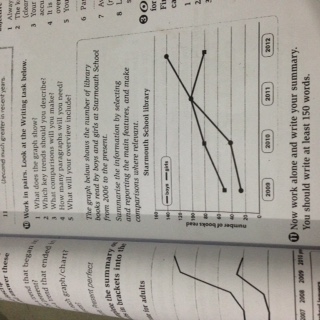
The line graph shows the number of library books which read by boys and girls at Starmouth school from 2009 until 2012. There were an information about amount of books and the trends of years between 2009 until 2012.
These boys and girls line was divided into the three grups lines. First one is 2009 until 2010, second is 2010 until 2011 and the last is 2011 to 2012. There was a slight increase in grup one at 30 books. After that, the group two numbers book also increased slightly at 20 books. Then, there was dramatic rise in numbers for group three at 140 books.
While, The number of book increased slightly in grup one at 10 books. Group two numbers rose dramatically at 60 books. The amount of books peaked in 2010. But, the last line was a sharp fall at 20 books.
However, both group one and two was stead felt trends. But, there was different trends in the last group which trend for boys higher than girls.
Overall, there was an upward trend in the three of groups.

IMG_1296.JPG
