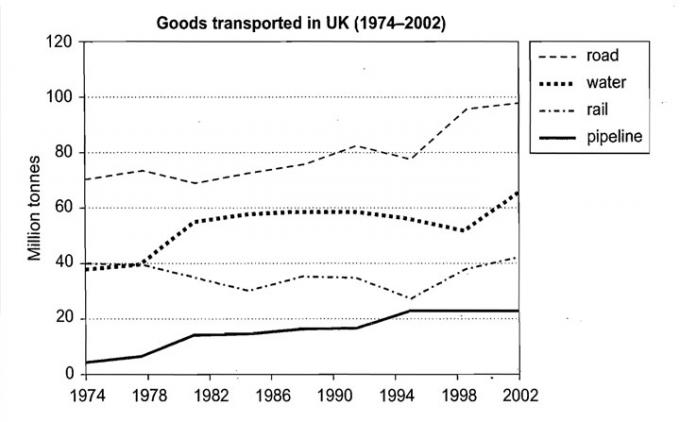
The graph below shows the quantities of goods transported in the UK between 1974 and 2002 by four different modes of transport.
Summarize the information by selecting and reporting the main features, and make comparisons where relevant.
The line graph provides information about four kinds of delivering transportation methods- road, water, rail and pipeline - in the UK from 1974 to 2002.
It is clear that the road delivery system was the majority for over 28 years. However, the number of shipped products had increased from the third to second between 1974 to 2002.
Both about 40 million tonnes of products were posted by trains and ships, nevertheless, the figure of shipped goods was slightly lower than those delivered by trains. At the year 1998, the total tonnes of products carried by cargos had surpassed the railway goods, from then, shipping tonnes levelled off and started to remain steady until 1993.
The minimum tonnes (30 million tonnes approximately) of rail transport mode can be observed at 1995. Although the number had continued to increase, by 2002, railway-delivered products remained almost the same tonnes at the year 1974, which is only a slightly higher than 40 million tonnes.

transportationuk_2..jpg
