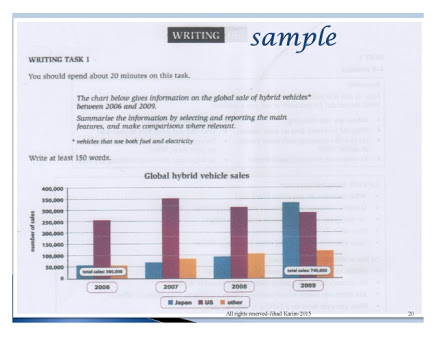
A breakdown of the international fuel and electricity machine markets in three different areas from 2006 to 2009, a 3-year period is presented in bar chart. Overall, it is immediately apparent that the total selling of the commodities increased twice as much as the first year during the period. In any case, US had the great number of transactions in the first three years before Japan passed the sales in the las year.
To begin, in 2006, total sales of the countries stood at 360.000 and were double to 740.000 in the period. On the other hand, US started just over 250.000 while Japan and other regions had the same trade at little bit over 50.000. During the next two years, US experienced a high of exactly 350.000 then dropped significantly by 40.000. However, although there was a considerable increase in the other two places, it reached approximately a hundred thousand sales until 2008.
Turning to the year 2009, the sales of hybrid transportation of US were predominantly undertaken by Japan at 280.000 and 335.000 respectively. As for the other regions, the total sales were still under 150.000.

unnamed_1.jpg
