Please grade my essay from 1 to 9 with 1 being the lowest and 9 being the highest.
You should spend about 20 minutes on this task.
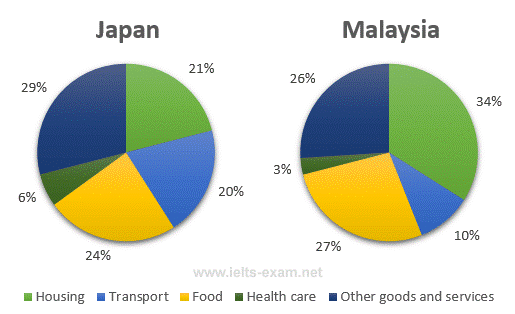
The pie charts below show the average household expenditures in Japan and Malaysia in the year 2010.
Summarise the information by selecting and reporting the main features, and make comparisons where relevant.
Write at least 150 words.
The pie charts shown depicts the different proportions of household expenditures in Japan and Malaysia in the year 2010.
There are significant differences in the areas where money were spent on different goods and services between the two countries -- Japan and Malaysia. While a typical Japanese household, proportionately spent most on sundry expenses, a Malaysian household, on the other hand, spent most on housing. Furthermore, Malaysia spent slightly more on food than Japan though the consumption of food were the second-most spent of the total aggregate expenditure. Another point to add is that in a Malaysian household there is a very narrow difference between the proportion of expenditure on food and miscellaneous expenses whereas for a Japanese household it is the housing and transport expenses that had a very narrow difference.
However, for both of the households there is one surprising similarity despite the huge differences which is that the least proportionately money spent were on transport and health care systems.

Average Household Expenditures by Major Category
