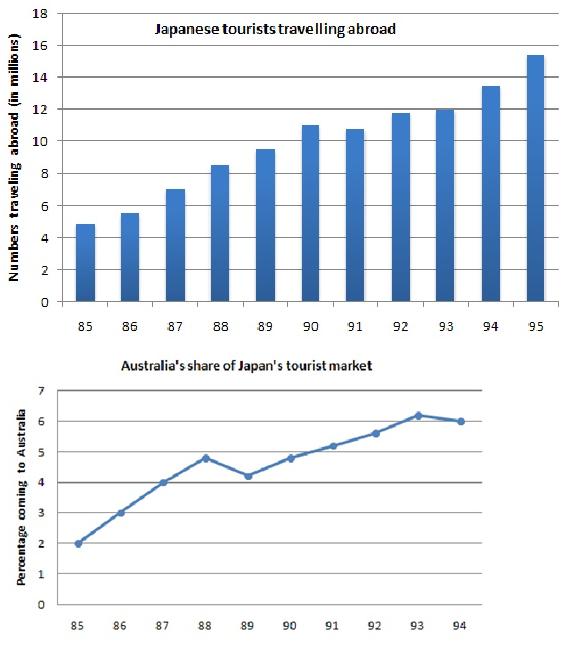
The bar chart illustrates the number of Japanese oversea visitors from 1985 to 1995, while the line graph shows the changes of Australia's share occupied by Japan's tourist between 1985 and 1994.
There was an upward trend in the number of Japanese travellers to other countries over the period of 11 years. In 1985, the figure was five million tourists. After this, it rose by approximately a million each year and reach 11 millions in 1990. From 1991 onwards, it continued to increase slightly and peaked at over 15 millions at the end of the period.
Besides, Japan's tourist grew considerably over the period. In 1985, it occupied for 2% of Australia's share then increased dramatically to nearly 5% three years later. Despite a slight fall in 1989,the figure grew by 0.5% each year and ended the period with 6% of total Australia's share.
On the whole, the growth in Japanese oversea travellers matched with the upward trend of Australia's share earned by Japan's tourist. Both figures could increase more from 1995 onwards due to the upward trends of the period.

IELTSWritingTask1.jpg
