The diagrams below give information on transport and car use in Edmonton.
Summarise the information by selecting and reporting the main features, and make comparisons where relevant.
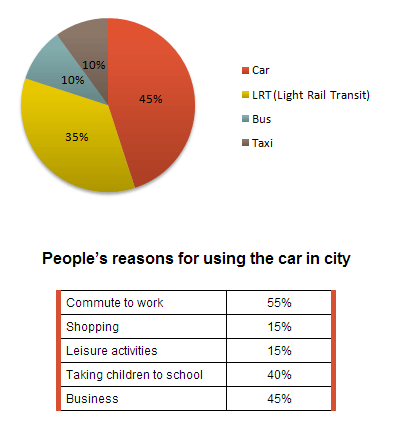
The pie chart provides information what the mean of transports are preferred by people in Edmonton, categorized by private and public transport, while the table illustrates why people use the car in urban area.
It is noticeable that people tend to drive a car to do some activities and the figure of using cars holds the largest proportion of other means. In any case, business activities support the distinct reasons why the private cars are chosen as a comfortable transportation in city.
The largest percentage of land transports is recorded by the private cars which beat just under a half, 45%, while coming out the second place is light rail transit which gain 35 percent of the whole proportion. Standing in contrast, each figure of bus and taxi stands at one in ten and those means of transport are the last option for people to deliver in some places.
In contrast to this, working activities, work and business reasons, reach a significant proportion at 100%. Whereas, people are usually taking children to school coming in the third reason of using a car in metropolitan area, the shopping and leisure activities have a minority reasons to drive a private car, at 30 per cent.

carincity.png
