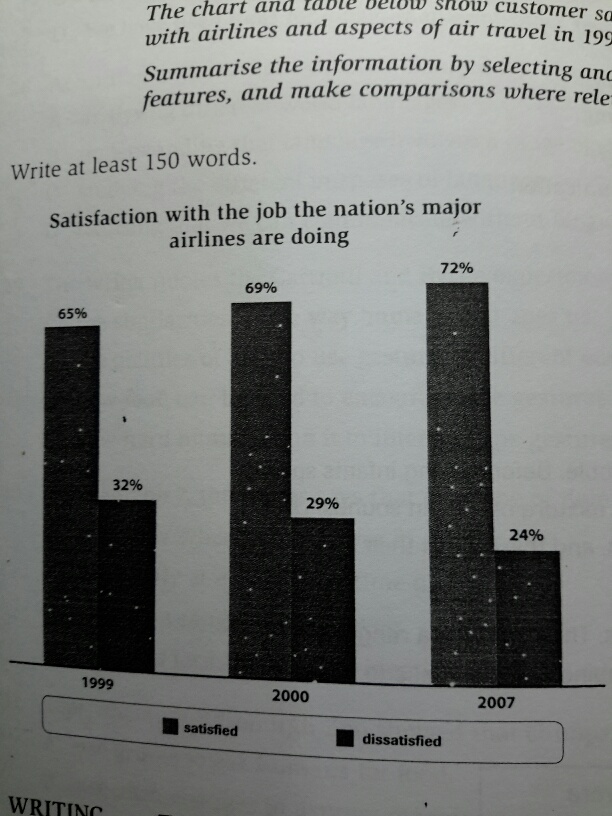
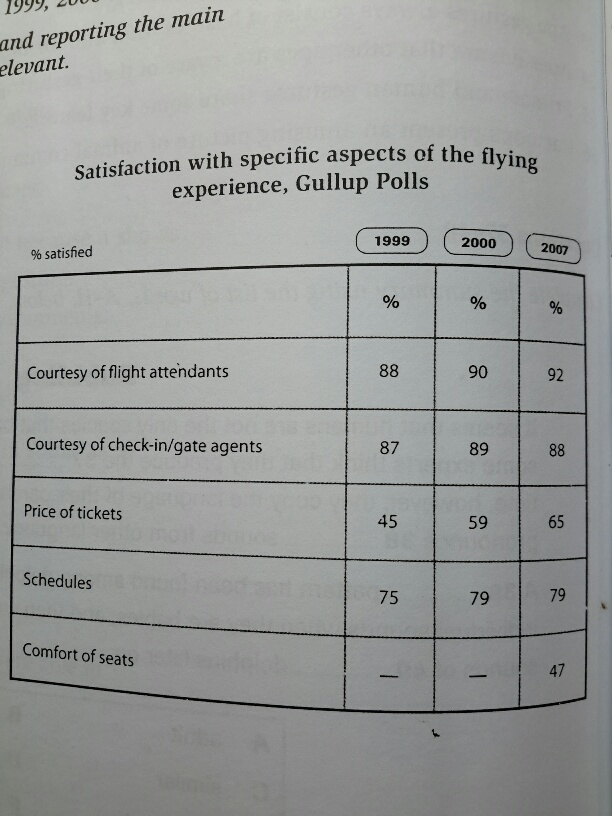
The customer contentment level of airlines and aspects of air travel in the US in 1999, 2000 and 2007 are depicted on the bar chart and table. The figures show that the highest and the lowest satisfaction level are experienced in 2007. While the most satisfaction aspect is the courtesy of flight attendants, the uncomfortable seats are the cause of people disappointment.
It is evidence that people's contentment on the accomplishment of the job of nation's major airlines is happened in 2007. The percentage is almost third four of the total. It is because the courtesy of flight attendants in that year increased by 2%. All of the other aspects also show the increment and peak at the end of the time frame. It can be seen that the satisfaction increase gradually from 1999 to 2007.
On the other hand, people who dissatisfied become lesser. At first, people are unhappy about the uncomfortable seats, pointed at 32%. Ever since, the quality of the seats continuously regenerated. Eight years later, the proportion of unhappy customer is significantly decrease to 24%.

20151127_230946_resi.jpg
20151127_231019_resi.jpg
