Hi all. It's my first time posting an essay here. Please give me some advice on it. If you're a teacher, and if it's not against the community rules, please help grade it too. Thanks!
P.S.: I am not able to type the symbol of 'degree'. 'C' will be referring to 'degree Celsius' in this essay.
My answer:
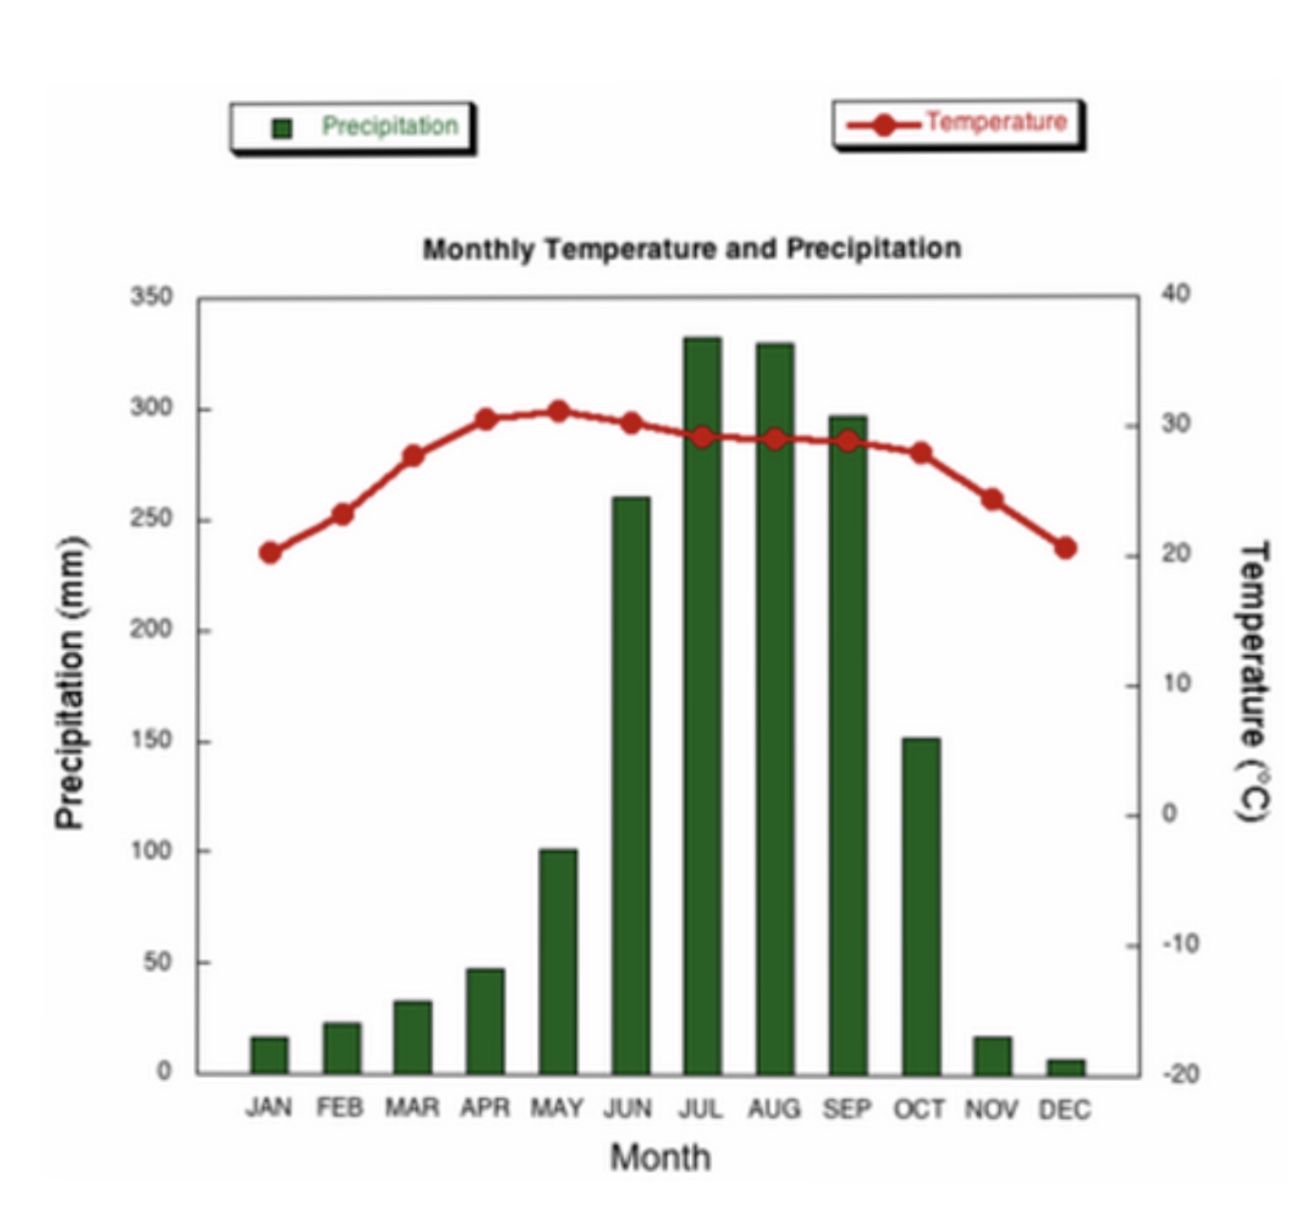
The bar and line chart demonstrates the amount of rainfall, measured in mm, and the temperature, with C as the unit, every month across a year.
Generally, the temperature change recorded monthly fluctuates between a mere 10 C whilst the measurement of precipitation differs significantly throughout one year.
It is evident that the amount of rainfall peaked in July and August at approximately 325 mm. In contrast, the temperature already reached its climax in April and May in which a 30 C was recorded. However, the measured rainfall and temperature both, coincidently, met their lowest point in December and January, with the minimum precipitation at 20 mm and temperature at 20 C.
It is further noted that for the amount of rainfall, it skyrocketed from 100 mm in May to 280 mm in the next month, and slumped, with an obvious difference of roughly 150 mm, from 300 mm in September to merely half of this amount in October. It further plunged to 25 mm in the following month. On the other hand though, the temperature recorded rose gradually from January to April and decreased steadily from May onwards.
(188 words, 20.5 mins)
P.S.: I am not able to type the symbol of 'degree'. 'C' will be referring to 'degree Celsius' in this essay.
the amount of rainfall and temperature (chart analysis)
My answer:
The bar and line chart demonstrates the amount of rainfall, measured in mm, and the temperature, with C as the unit, every month across a year.
Generally, the temperature change recorded monthly fluctuates between a mere 10 C whilst the measurement of precipitation differs significantly throughout one year.
It is evident that the amount of rainfall peaked in July and August at approximately 325 mm. In contrast, the temperature already reached its climax in April and May in which a 30 C was recorded. However, the measured rainfall and temperature both, coincidently, met their lowest point in December and January, with the minimum precipitation at 20 mm and temperature at 20 C.
It is further noted that for the amount of rainfall, it skyrocketed from 100 mm in May to 280 mm in the next month, and slumped, with an obvious difference of roughly 150 mm, from 300 mm in September to merely half of this amount in October. It further plunged to 25 mm in the following month. On the other hand though, the temperature recorded rose gradually from January to April and decreased steadily from May onwards.
(188 words, 20.5 mins)

8295B40FC15642A79.jpeg
