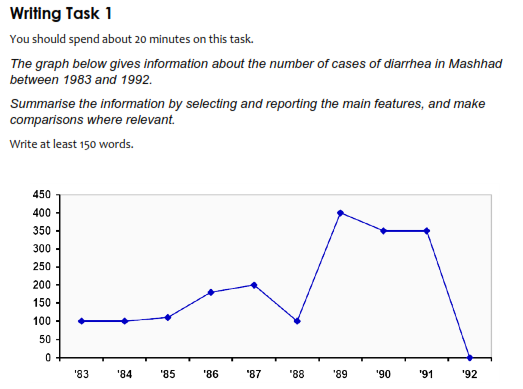
The line graph indicates about the proportion of diarrhea patients in Mashhad for nine years period from 1983 until 1992. Overall, people who get diarrhea diseases rose slightly in the first four years before a significant fluctuation is occurred in the last five years. While, the figure reach a peak in 1989 and show a dramatic drop which made Mashhad free from diarrhea cases at the end of the observation in 1992.
First of all, there was a hundreds diarrhea patients in Mashhad in 1983. It remained steady for the following year, before it rose slightly for the next three years to approximately 200 cases in 1987. After which, the figure experienced a small decrease to a little less than 100 patient in 1988. Afterwards, it increased dramatically and reached a peak at a little more than 400 cases in 1989. Then it was leveled of to just over 350 patients and remained stable in the next two years. Lastly, the cases dropped enormously and no people found to be diarrhea patients in 1992. (174 words)
First of all, there was a hundreds diarrhea patients in Mashhad in 1983. It remained steady for the following year, before it rose slightly for the next three years to approximately 200 cases in 1987. After which, the figure experienced a small decrease to a little less than 100 patient in 1988. Afterwards, it increased dramatically and reached a peak at a little more than 400 cases in 1989. Then it was leveled of to just over 350 patients and remained stable in the next two years. Lastly, the cases dropped enormously and no people found to be diarrhea patients in 1992. (174 words)

WR_1.PNG
