shop closures and openings
Question:
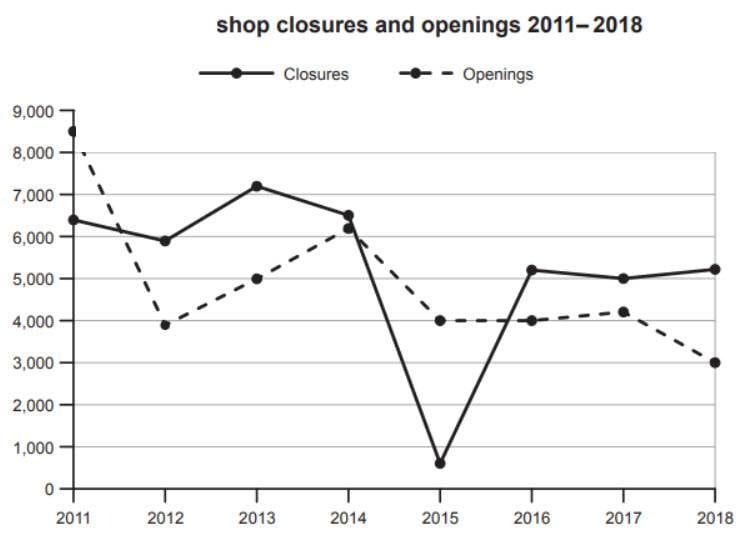
The graph below shows the number of shops that closed and the number of new shops that opened in one country between 2011 and 2018.
Summarise the information by selecting and reporting the main features, and make comparisons where relevant.
Picture:
My essay:
The line graph compares the number of shop closures and openings in one nation from 2011 to 2018.
Overall, it is clear that the number of shop closures changed considerably and tended to increase, whereas that of openings declined over the whole period.
First of all, in 2011, the figure for shops that closed was about 6000. However, in 2012, the chart witnessed a decline to exactly 6000 shops closing. In 2015, it decreased to less than 1000, the lowest one in the period of seven years. Also, approximately 5000 shops closed in 2018.
Moreover, at the beginning of the period, the number of shop openings stood at more or less 9000 while that in 2012 was 4000. Next, there was a dramatic rise of 2000 shops between 2012 and 2014, and then went down sharply to 4000 again in 2015. After that, this figure had been remaining until 2016. Finally, at the end of the period, the number of new shops that opened in that country was precisely 3000.
(167 words)

Linegraph_C17_T4_.j.jpg
