I'm really thankful when someone helps me improve this essay. Thank you!
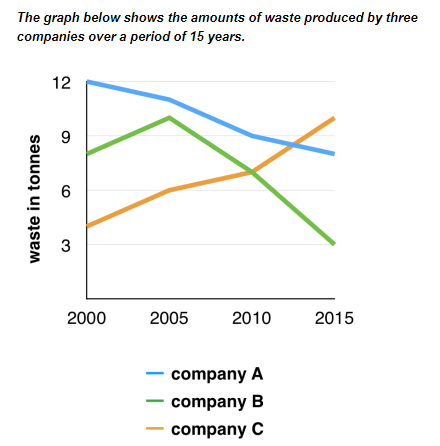
The line graph illustrates how much waste three companies released during a 15 year period from 2000 to 2015. Units are measured in tonnes.
Overall, while the amount of waste produced witnessed a decrease in 2 companies A and B, the opposite was true for the figure for company C.
In 2000, company A held the leading position by releasing 12 tonnes waste while the figures for company B and C were nearly 9 and just above 3 respectively. Over the following 5 years, the amount of waste produced by company A declined slightly by approximately 1. By contrast, both company B and C experienced a moderate rise of nearly 2 in 2005.
The amount of waste released by company A had stood at 11 by 2005 and dropped considerablely by nearly 3 during the following 10 years. In 2005, the figure for company B peaked at nearly 10 before undergoing a dramatical decrease of 7 at the end of period. Meanwhile, a significant climb of 4 was recorded in the amount of waste produced by company C during a 10 year period from 2005 to 2015.
Waste statistics
The line graph illustrates how much waste three companies released during a 15 year period from 2000 to 2015. Units are measured in tonnes.
Overall, while the amount of waste produced witnessed a decrease in 2 companies A and B, the opposite was true for the figure for company C.
In 2000, company A held the leading position by releasing 12 tonnes waste while the figures for company B and C were nearly 9 and just above 3 respectively. Over the following 5 years, the amount of waste produced by company A declined slightly by approximately 1. By contrast, both company B and C experienced a moderate rise of nearly 2 in 2005.
The amount of waste released by company A had stood at 11 by 2005 and dropped considerablely by nearly 3 during the following 10 years. In 2005, the figure for company B peaked at nearly 10 before undergoing a dramatical decrease of 7 at the end of period. Meanwhile, a significant climb of 4 was recorded in the amount of waste produced by company C during a 10 year period from 2005 to 2015.

l.png
