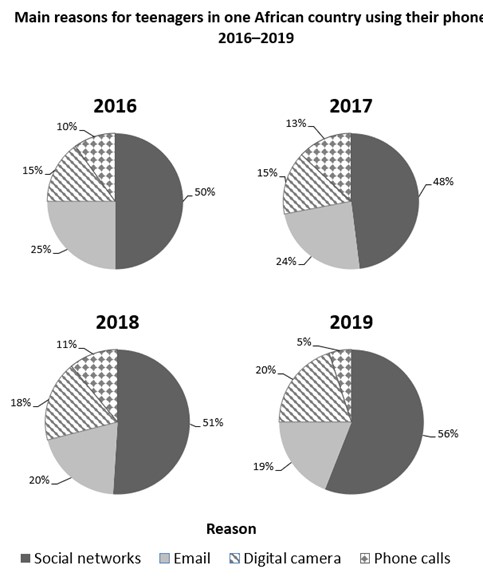
The chart shows the results of surveys in one African country asking teenagers the main reasons for using their phones between 2016 and 2019.
My answer:
The pie charts illustrate what cell phones was used for among young people in a country located in Africa from 2016 to 2019.
It is noticeable from the charts that African teenagers tended to use their phones most for accessing social networks while making phone call function was concerned least throughout the period.
Regarding data during the period, social networks was most commonly used by African teenagers, which accounted for an average of 50% each year. Meanwhile, making phone calls remained least using from year to year, and this function even made up just 5% in total purposes of using phones in 2019.
From 2016 to 2019, the number of African teenagers using phones for sending email experienced a slight drop, from 25% at the beginning to 19% at the end. By contrast, there were yearly more people using phones because of its digital camera. The percentage of people using camera phone started to increase gradually from 15% in 2016 to 20% in 2019.
Please help me check the writing and give me a mark if it is possible.
Thank you
Summarise the information by selecting and reporting the main features, and make comparisons where relevant.
My answer:
The pie charts illustrate what cell phones was used for among young people in a country located in Africa from 2016 to 2019.
It is noticeable from the charts that African teenagers tended to use their phones most for accessing social networks while making phone call function was concerned least throughout the period.
Regarding data during the period, social networks was most commonly used by African teenagers, which accounted for an average of 50% each year. Meanwhile, making phone calls remained least using from year to year, and this function even made up just 5% in total purposes of using phones in 2019.
From 2016 to 2019, the number of African teenagers using phones for sending email experienced a slight drop, from 25% at the beginning to 19% at the end. By contrast, there were yearly more people using phones because of its digital camera. The percentage of people using camera phone started to increase gradually from 15% in 2016 to 20% in 2019.
Please help me check the writing and give me a mark if it is possible.
Thank you

Picture1.jpg
