Unanswered [1]
  

Home / Writing Feedback   % width   Posts: 3


The majority of UK students speak at least one other language in addition to English


msyoshino 1 / 1  
Jul 26, 2018   #1

students in a UK university able to speak other languages


The charts below show the proportion of British students at one university in England who were able to speak other languages in addition to English, in 2000 and 2010.

Summarise the information by selecting and reporting the main features, and make comparisons where relevant.


Write at least 150 words.

My essay:

The pie charts compare the percentage of students in a UK university who could speak at least one more language besides English in 2000 and 2010.

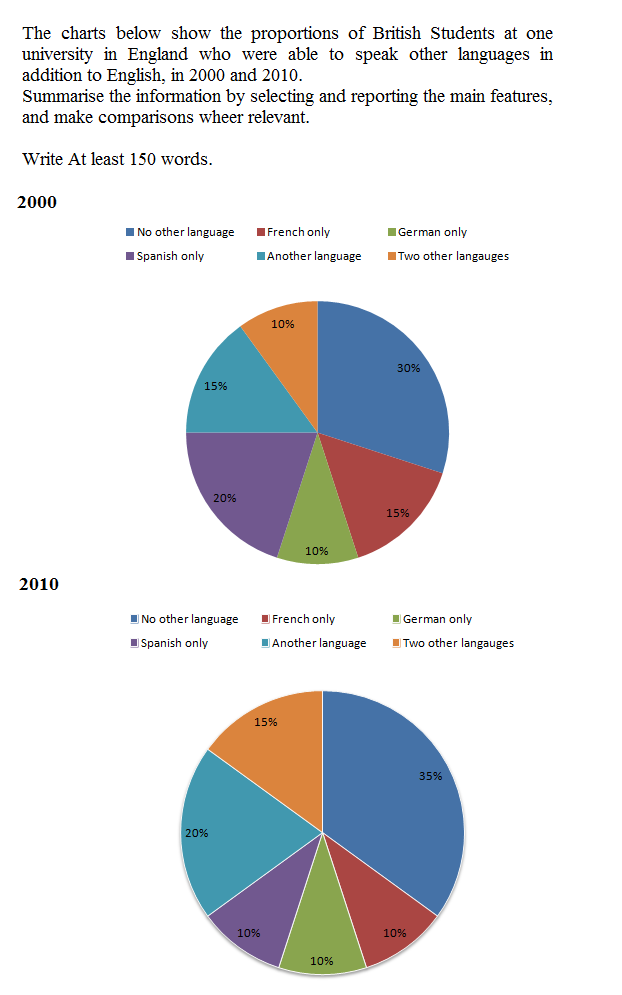
It is evident that the majority of the students spoke at least one other language in addition to English. Only about one-third of the students spoke English solely, with a slight five percent increase over the period. It is also notable that the proportion of German speakers studying in this university remained unchanged at ten percent.

On the other hand, the percentage of Spanish and French-speaking students saw a decline, with the former by half and the latter by one third, both to ten percent in 2010. However, the proportion of students who were trilingual or spoke another language rose by five percent to 20% and 15% respectively in 2010.

To sum up, substantial variations can be found regarding the percentage of students who were bilingual or trilingual.

  • IELTS_task_1.png


Holt  Educational Consultant - / 15467  
Jul 27, 2018   #2
@msyoshino while you did write a little more than the 150 word requirement, your presentation remains incomplete. You do have a semblance of a 4 paragraph presentation here but you lack comparison points between the two pie charts, a proper summary overview, and a clear presentation of the information provided. The correct format for this essay would have been:

1. Summary overview with complete information and trending statement
2. Information from the 2000 chart
3. Information from the 2010 chart
4. Comparison points

It would have been better for your essay if you used the proper percentage presentations from the original charts because using the fractional form does not really give the reader a clear idea of the measurements involved. Your presentation leaves the reader guessing in most parts and will be considered to be giving the reader stress, which could affect your C&C and GRA scores. Since the Task 1 essay is all about information accuracy and clear paraphrasing, you should always use the information as originally presented in the chart.

The opening summary is incomplete. It should read as follows:

Two pie charts have been provided for reporting and comparing in terms of available information. The pie charts represent the data regarding the measurement of British students enrolled at an undisclosed British university who had the ability to converse in other languages aside from English in the years 2000 and 2010. The measurements for the 6 sections representing No other language, Spanish only, French only, Another language, German only, and Two other languages were presented in the percentage format. Overall, the trend showed an increase in No other language learners which was up 5 percent in 2010 from the original 2000 measurement. .

The summary overview is the most important aspect of the Task 1 essay writing because this shows your ability to analyze the report and pick out the important information that can be useful to the reader. That is why you need to present all of the important information that is given to you in the original discussion and instructions. Doing so will increase your TA scores to the highest possible marking.

In addition to that, you should try to write around 175 words to be sure that you did not miss any important information in your presentation. Be particularly cognizant of your comparison data presentation as that is clearly indicated as a requirement in the task instruction. Look for the small similarities or extended trending explanation as part of the comparison presentation. By the way, you do not need to write a concluding sentence / paragraph in a Task 1 essay. That is not required as this is an analytical report essay, not an opinion essay.
OP msyoshino 1 / 1  
Aug 7, 2018   #3
Hello @Holt
Thank you so much for the feedback. It's extremely helpful and I'm so glad that I found this forum. I've rewritten the essay with the provided introductory paragraph and ended up with 182 words. It would be great if you could kindly offer your insight again.

My essay:

The pie charts represent the data regarding the measurement of British students enrolled at an undisclosed British university who had the ability to converse in other languages aside from English in the years 2000 and 2010. The measurements for the 6 sections representing No other language, Spanish only, French only, Another language, German only, and Two other languages were presented in the percentage format. Overall, the trend showed an increase in No other language learners which was up 5% in 2010 from the original 2000 measurement.

As indicated, roughly one-third of the learners could not speak any other languages (30% in 2000 and 35% in 2010). As for students who could converse in Spanish, the proportion halved to 10% by 2010.

On the other hand, in 2000, French and Another language speakers accounted for identical proportions at 15%, whereas by 2010 the former declined and the latter increased, both by 5%. The percentages of German and Two other languages speakers were also the same at 10% in 2000. Although in 2010 the former remained unchanged, the latter saw an increase of 5%.


Home / Writing Feedback / The majority of UK students speak at least one other language in addition to English
ⓘ Need Writing or Editing Help?
Fill out one of these forms for professional help:

Best Writing Service:
CustomPapers form ◳

Graduate Writing / Editing:
GraduateWriter form ◳

Excellence in Editing:
Rose Editing ◳

AI-Paper Rewriting:
Robot Rewrite ◳