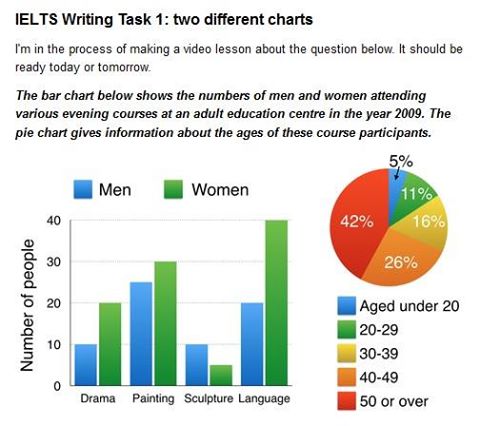
The bar chart shows the numbers of men and women attending various evening courses at an adults education centre in the year 2009. The pie chart gives information about the ages of these course participants. Overall, it can be seen that women comprised the majority of the numbers of people who attending the courses and the ages of participants was highest for participants in 50 or over.
The bar chart indicates that drama and language class the proportion of female students was twice the number of male pupils, 20 women against 10 men in the former, while 40 women in comparison with only 20 men in the latter. The number of women participants was also higher than the number of men joining the painting class, with figures at 30 for women and 25 for men. In contrast, the trend was reversed in people enrolling for sculpture course, the figure for men doubled than for women, respectively at 10 and 5.
Turning to the pie chart the majority of people who took part in these courses was aged 50 or over. While the people who under 20 was the lowest proportion at 5%. The percentage of people who aged 40-49 was nearly double as high as those who was 20-29, respectively at 26% and 11%.

tabel_3009.jpg
