Please help me with the correction of this task. Many thanks in advance.
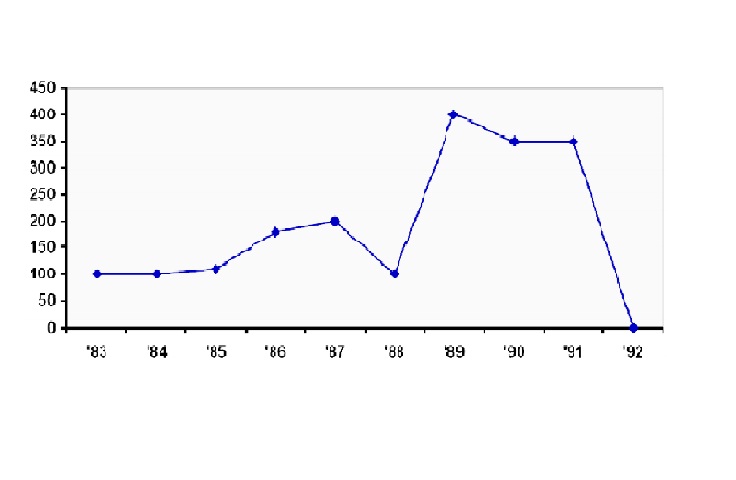
The graph below gives information about the number of cases of diarrhea in Mashhad between 1983 and 1992.
Summarise the information by selecting and reporting the main features, and make comparisons where relevant.
Write at least 150 words.
The line graph illustrates how many people contracted diarrhea in Mashhad throughout the period from 1983 to 1992.
Overall, cases of diarrhea remained relatively static over the first six years of the period shown before experiencing a wild fluctuation between 1988 and 1992.
It can be seen from the graph that the number of diarrhea sufferers levelled out at around 100 cases until 1985 and doubled over the next two years. This was followed by a sudden drop in 1988 to around the same level as it was in 1983. Afterwards, the figures rose steeply to reach a peak of 400 cases in 1989, after which there was a slight decrease of approximately 50 cases. The figures stayed unchanged till 1991 before 1992 came with an enormous plummet to reach a low of zero.
To sum up, the figures for cases of diarrhea were at their highest in 1989, whereas their record low could be observed in 1992.
(158 words)

1.jpg
