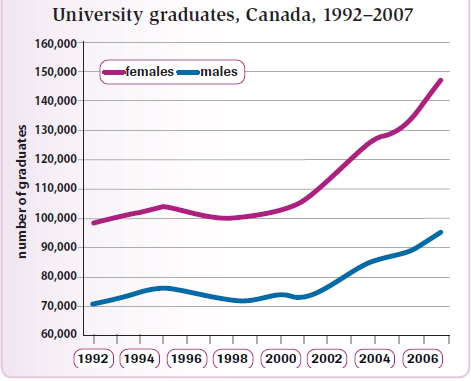
A breakdown of the information about both men and women who graduated in Canada over 15-year period is presented in the line graph. It is measured in the number of graduates every two years. Overall, the most significant facts to emerge are that both men and women had similar patterns and the figure of women led by far than men over the period shown.
In 1992, the number of women graduates stood at just under 100,000, higher than men. Subsequently, there was an increase to roughly 105,000 graduates in 1995, which was followed by a slight fall in 1998. From 1998 to 2006, a dramatic growth is shown by female graduates, in which its figure hit a high of 148,000 people in the end of the period
On the other hand, the initial figure for men was around 70,000 graduates. Then, its pattern showed a fluctuation until 2001. From 2001, men level rose gradually to hit at 95,000 graduates in 2006, lower than women in the end of the time frame shown.

290808_1_o.png
