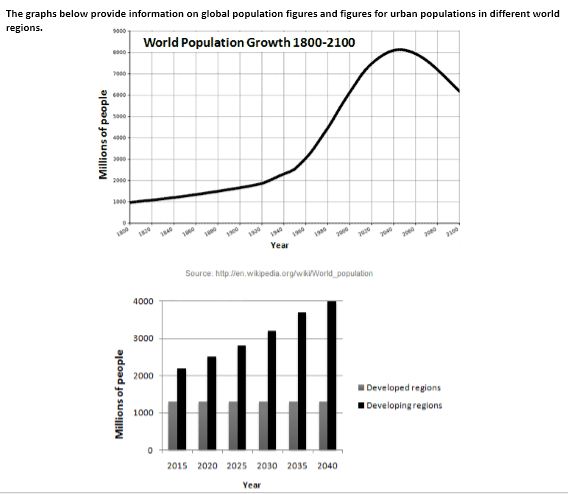
The line chart reveals data about the growth of people figures in the world from 1800 to present and its prediction nine decades later. The bar chart compares the prediction of global population growth in two different regions between 2015 and 2040. Both data are measured by millions of people.
Overall, the quantity of people has increased since 1800 and will increase continuously and then will decrease. However, developing regions will dominate whole global population,
The number of world population stood at 1,000 million and had increased steadily until 1950. After that, the global population has risen significantly until now and is going to peak at about 8,000 million in 2040. On the contrary, 2040 to 2100 will witness a dramatic decrease to around 6,000 million.
Finally, the world population will be dominated by developing areas, a significant rise of approximately 2,000 million, from around 2,000 in 2015 and 4,000 million in 2040, will be experienced by the regions. In contrast, there will not be more than 1,500 million in developed areas and it is going to remain stable during the period.

World Population Growth
