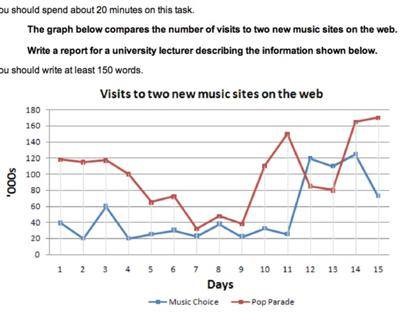
A breakdown of the information about the comparison between two kinds of new music sites visitor in a fifteen-day period measured in thousand is illustrated in the line graph. Overall, it can be seen that both figures has similar upward trend. Also, the pop parade music are more popular than the music choice.
To begin, initially, the number of people visiting the music choice and the pop parade sites start at approximately 40 and 120 thousands respectively. In the next following day, the former experiences a significant incline and is followed by a stable fluctuation. Meanwhile, the latter shows a gradual decline in the total of visitors of the music sites by 80,000s in the ninth day.
A part from previous comparison, the remarkable changes can be seen in the twelfth and thirteenth day when the number of music choice site visitors overtakes the other. However, the number of people visiting the pop parade site reaches a peak at over 160,000s. Eventually, In any case the music choice site visitor is directly below the highest by more or less 80,000s.

task_1__01.jpg
