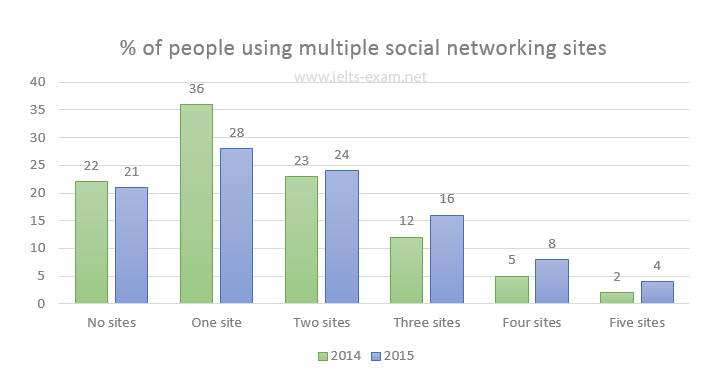
The chart below gives information about the number of social networking sites people used in Canada in 2014 and 2015.
My essay:
The bar chart compares the usage of social networking sites by Canadians in 2014 and 2015, measured in terms of percentages. It divides people into six categories: those who used no sites, one, two, three, four and five sites.
In general, the percentages of people using one site exclusively remained the highest percentages over the period covered whereas that of five sites were the smallest
While slightly more than one in every ten Canadians did not use any social networks in these two years, the rest of them did. Of these particular people, a negative correlation occurred: as the number of these sites increases, the relative amounts of people decrease, especially in those using two sites or more with a correlation coefficient of -2. The biggest overall decrease happened in the one site category, falling from 36% in 2014 to 28% in 2015. By contrast, the proportions for those using multiple sites marginally rose; in particular, rising the least in the two sites group, by only 1%, and the most in the three sites, by 4%.
Summarize the information by selecting and reporting the main features, and make comparisons where relevant
My essay:
The bar chart compares the usage of social networking sites by Canadians in 2014 and 2015, measured in terms of percentages. It divides people into six categories: those who used no sites, one, two, three, four and five sites.
In general, the percentages of people using one site exclusively remained the highest percentages over the period covered whereas that of five sites were the smallest
While slightly more than one in every ten Canadians did not use any social networks in these two years, the rest of them did. Of these particular people, a negative correlation occurred: as the number of these sites increases, the relative amounts of people decrease, especially in those using two sites or more with a correlation coefficient of -2. The biggest overall decrease happened in the one site category, falling from 36% in 2014 to 28% in 2015. By contrast, the proportions for those using multiple sites marginally rose; in particular, rising the least in the two sites group, by only 1%, and the most in the three sites, by 4%.

nosite.png
