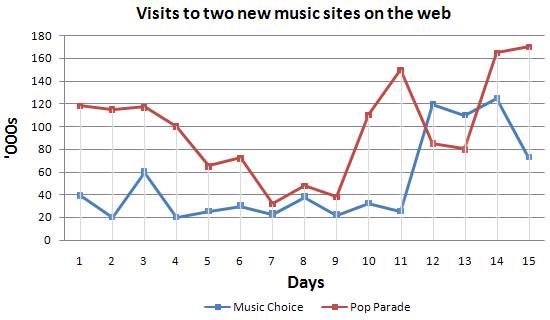
The line charts present the number of visitations on two different music websites during fifteen days, a half-month period (measured in thousands). Overall, despite some fluctuation, over the period as a whole the levels of visits increase in both of sites. However, Pop Parade show more occasions throughout the period.
In the first day, the visitations on Pop Parade site begin in 120 and fall gradually. While the number hit a low of 30 over a week, it experience a significant growth at approximately 160 in the 11th day. Following that, the figure suddenly drop to 80 and then it show a gradual rebound at roughly 180 in the last day.
Turning to Music Choice, 40 of occasions surfing on the website rise to 60 in the following three days. Afterwards, the number depict a fluctuation during the fourth to the eleventh and significantly jump to 120, approximately a 100-rise in a day. The remaining of period show a sharp decline at above 60.

13177905_10204576007.jpg
