Topic:
Full paragraph:
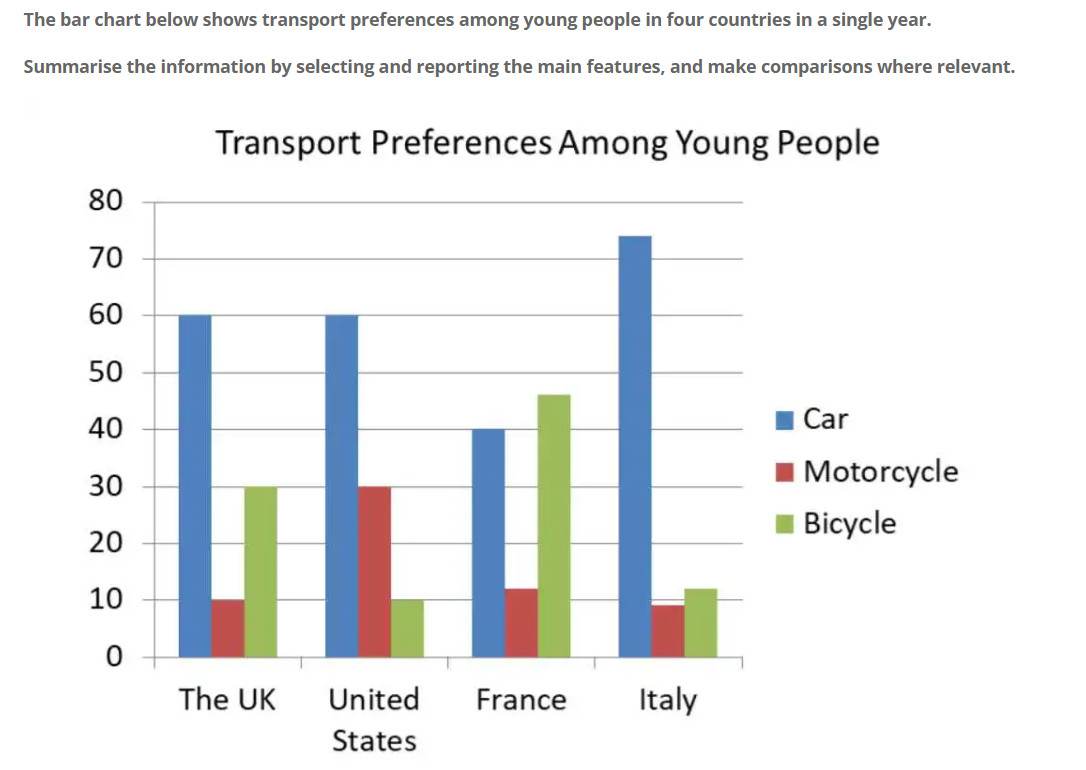
The bar chart gives information about the preferences of young people in four distinct countries in using three means of transportation in an unknown year.
In general, it is clear that car is the most popular transport among 4 countries except for France, whereas the lowest figure is seen in those driving motorbike, except for the US.
As can be seen from the chart, the proportion of car in the UK and the US are the same, standing at 60%. In the UK, the proportion of bicycle is 3 times as much as the proportion of motorcycle, while the US has the contrasting figures in these types of vehicle
Another striking point is the percentage of using car in Italy, standing at approximately 20%, taking the first place among 4 countries. In addition to this, the figure for bike in France is the highest while the lowest figure for this kind of transport belongs to Italy and the US, at around 10%.
The bar chart below shows transport preferences among young people in four countries in a single year.
Full paragraph:
The bar chart gives information about the preferences of young people in four distinct countries in using three means of transportation in an unknown year.
In general, it is clear that car is the most popular transport among 4 countries except for France, whereas the lowest figure is seen in those driving motorbike, except for the US.
As can be seen from the chart, the proportion of car in the UK and the US are the same, standing at 60%. In the UK, the proportion of bicycle is 3 times as much as the proportion of motorcycle, while the US has the contrasting figures in these types of vehicle
Another striking point is the percentage of using car in Italy, standing at approximately 20%, taking the first place among 4 countries. In addition to this, the figure for bike in France is the highest while the lowest figure for this kind of transport belongs to Italy and the US, at around 10%.

326633194_5909936091.jpg
