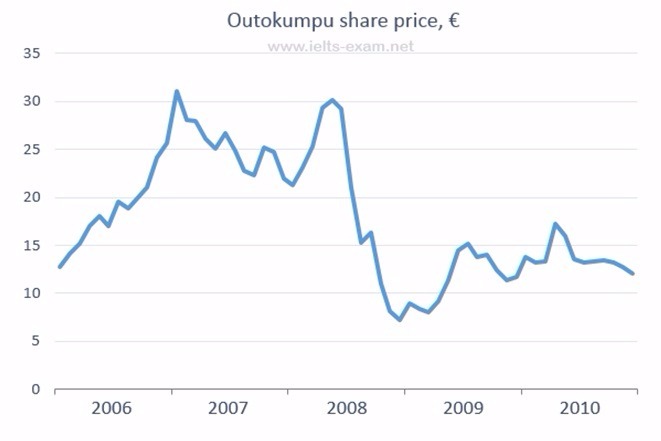
The chart illustrates the Outokompu stock price trend over a five-year period from 2006 to 2010 and is measured in Euro. Overall, it can be seen that, despite some fluctuations, the rate reached the peak in the end 2006 and almost virtually the highest score in the middle 2008 before jumped dramatically for the next following years.
First of all, the price stood at around 12 in early January 2006. Then, 2006 saw a significant rise in stock price with the level reaching the peak of more than 30 in the end of 2006. By 2007, it had fallen to approximately 22.
There was a significant improve during the first semester 2008 which was the second highest price. Then, it jumped sharply to 6 which was the lowest of that year. However, this figure increased dramatically over 6 months in 2009, but there was then a fluctuation until in the middle of 2010. Following this, the stock price was a virtually steady to finish the period at 11 that the level almost back to the starting point in early 2006.

AkHq7TWXk9l5ynxtIKqB.jpg
