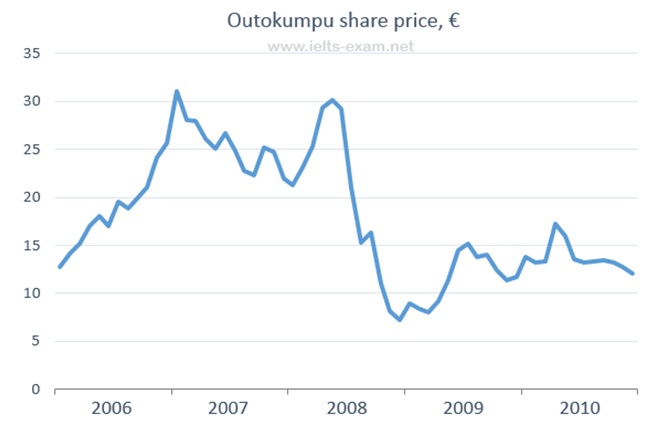
The line graph presents the data about the stock price movement of Outokumpu corporation started from January 2006 to December 2010 and is measured in euros (). It is noticeable that the volatility of Outokumpu's stock price was very fluctuative and reached a highest point in the end of 2006.
First of all, Outokumpu's price stood at roughly 10 to 15 in the beginning of 2006 then rose gradually until reached a highest level to more than 30 in the end of 2006. Following this, the stock price Outokumpu fluctuated until reached 20 in the end of 2007.
After that, in the fisrt quartal of 2008 the share price grew rapidly and almost reached a highest point in 2006. However, the stock price plunged dramatically and jumped to a lowest level at around 5 to 10 in the end of 2008. Started in 2009, the stock price increased slowly and grew with small volatility until in the end of period.

Outokumpu Stock Price in Euros between 2006 and 2010
