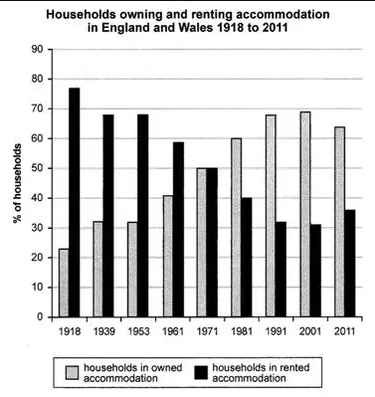
The chart below shows the percentage of households in owned and rented accomodation in England and Wales between 1918 and 2011.Summarise the information by selecting and reporting the main features, and make comparisons where relevant.
The bar chart illustrates the proportion of households in owned and rented accommodation in England and Wales from 1918 and 2011. Overall, it can be seen that the figure for households in owned accommodation experienced an increase,while households in rented accommodation decreased.
In the year 1918, only around 23% of households had house ownership, compared to 80% of families having rented accomodation. However, over the next 53 years, the percentage of families having their own accommodation witnessed a rise, while the data for households with rented accommodation experienced a decline. In 1971, the figures for households in owned property and households in rented property were both 50%
In 1981, families with private property were 60%, completely overtaking households with rented houses, which was 40%. One striking feature is that between 1991 and 2011, families with private property almost doubled households with rented accommodation. At the end of the period, the data for families with private property and rented accommodation were 64% and 39% respectively.
Writer's notes: Feedback would be massively appreciated. <3

Capture.PNG
