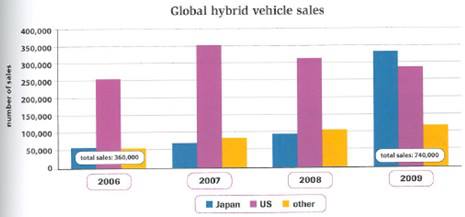
The bar chart compares the number of global hybrid vehicle sales in Japan, the United States and other countries from 2006 to 2009. It is noticeable that the total sales of the vehicles in 2009 was virtually double the number of that in 2006. The pattern of sales during 2006 until 2008 were dominated by the US, while in 2009 Japan showed global domination of transport sales.
To begin, the first three years during that period of time witnessed similar pattern, which was most of vehicles that use both fuel and electricity were sold by the US. The number of global sales stood at 360,000 in 2006. US contributed 250,000 of that, whilst Japan and other countries sold slightly above 50,000 transportation. 2007 saw the largest sales by US, which was 300,000. However, in the next year this number was smaller, and meanwhile Japan and other countries steadily rose from the beginning.
Turning to the one with different pattern, in 2009 Japan sold most number of hybrid transport, which was aproximately 325,000 units. Moreover, the total sales of vehicles around the world was two times larger than those in 2006.

266144_1_o.jpg
