You should spend about 20 minutes on this task.
Summarize the information by selecting and reporting the main features and make comparisons where relevant.
You should write at least 150 words.
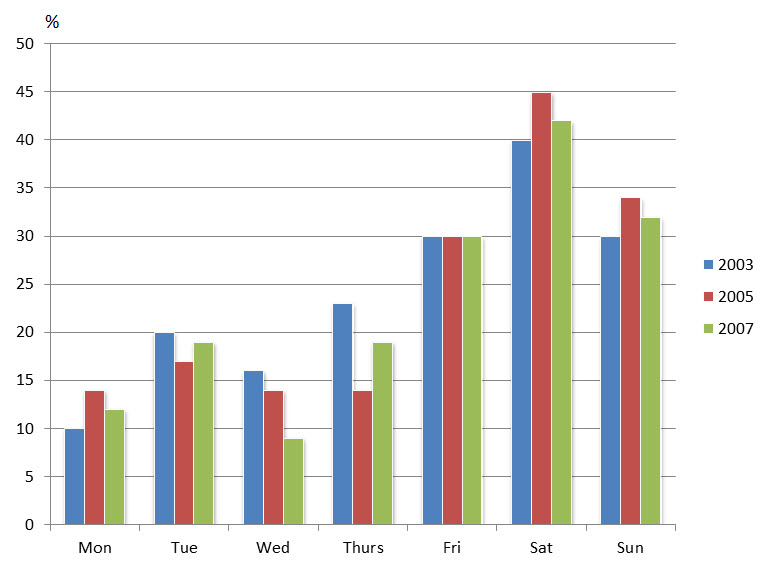
The given chart depicts how much attendance at movie theaters was in a particular European nation on several days in 2003, 2005 and 2007. At the first glance, withstanding various fluctuations, there was an ascending trend in the percentage of people attending theaters. Additonally, Saturday was the most preferred day, at which attracted the highest proportion of people, compared with others.
Looking at the graph in more details, as far as Monday, Saturday and Sunday were concerned, they born resemblance in the tendency of proportion of attendance, with 10%, 40%, 30% in 2003; about 14%, 45%, nearly 34% in 2005; 12%, 42%, 32% in 2007 respectively.
Turning to Tuesday and Thursday, starting at 20% and 23% in 2003 respectively, they experienced a steady decrease of 2% and 9% in 2007. However, in the end of the period, they scrambled again to 19%. Meanwhile, there was a significant drop in the amount of people going to cinemes on Wdenesday, going down from 16% in 2003 to 9% in 2007. In contrast, the ratio of attendance at theater on Friday remained unchanged, with 30% during the surveyed period.
The graph below shows the percentage of people going to cinemas in one European country on different days.
Summarize the information by selecting and reporting the main features and make comparisons where relevant.
You should write at least 150 words.
The given chart depicts how much attendance at movie theaters was in a particular European nation on several days in 2003, 2005 and 2007. At the first glance, withstanding various fluctuations, there was an ascending trend in the percentage of people attending theaters. Additonally, Saturday was the most preferred day, at which attracted the highest proportion of people, compared with others.
Looking at the graph in more details, as far as Monday, Saturday and Sunday were concerned, they born resemblance in the tendency of proportion of attendance, with 10%, 40%, 30% in 2003; about 14%, 45%, nearly 34% in 2005; 12%, 42%, 32% in 2007 respectively.
Turning to Tuesday and Thursday, starting at 20% and 23% in 2003 respectively, they experienced a steady decrease of 2% and 9% in 2007. However, in the end of the period, they scrambled again to 19%. Meanwhile, there was a significant drop in the amount of people going to cinemes on Wdenesday, going down from 16% in 2003 to 9% in 2007. In contrast, the ratio of attendance at theater on Friday remained unchanged, with 30% during the surveyed period.

RAT6W3_0.jpg
