time spent on different activities
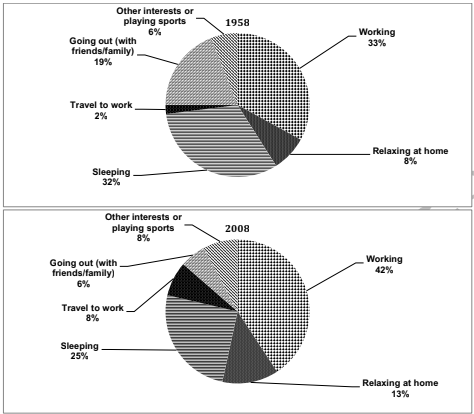
The pie chart gives information about the proportion of time which adults spent on different activities in a country in 1958 and 2008.
Overall, the percentage of people spending on working was the highest in two years. Besides, the figure of travel to work was the lowest in 1958, and the time to go out with friends or family was the lowest in 2008.
Considering the time to work, Relax and sleeping, people who spent time working was the highest at 33 percent in 1958, then it increased dramatically to 42% in 2008. According to the data of relaxation at home, adults spent time in this activity was 8% in 1958. After 50 years, there was an increase of 5%. The figure of sleeping was the second after working, it was 32% in 1958 and 25% in 2008.
Moving to the remaining four activities, the percentage of time spent on travel to work was the lowest in 1958, then it rose to 8% in 2008. Next, the data of going out with family and friends was 6% in 2008, it decreased by 13 percent than 50 years ago. Finally, other activities of adults were 6% and 8% respectively.

1.png
