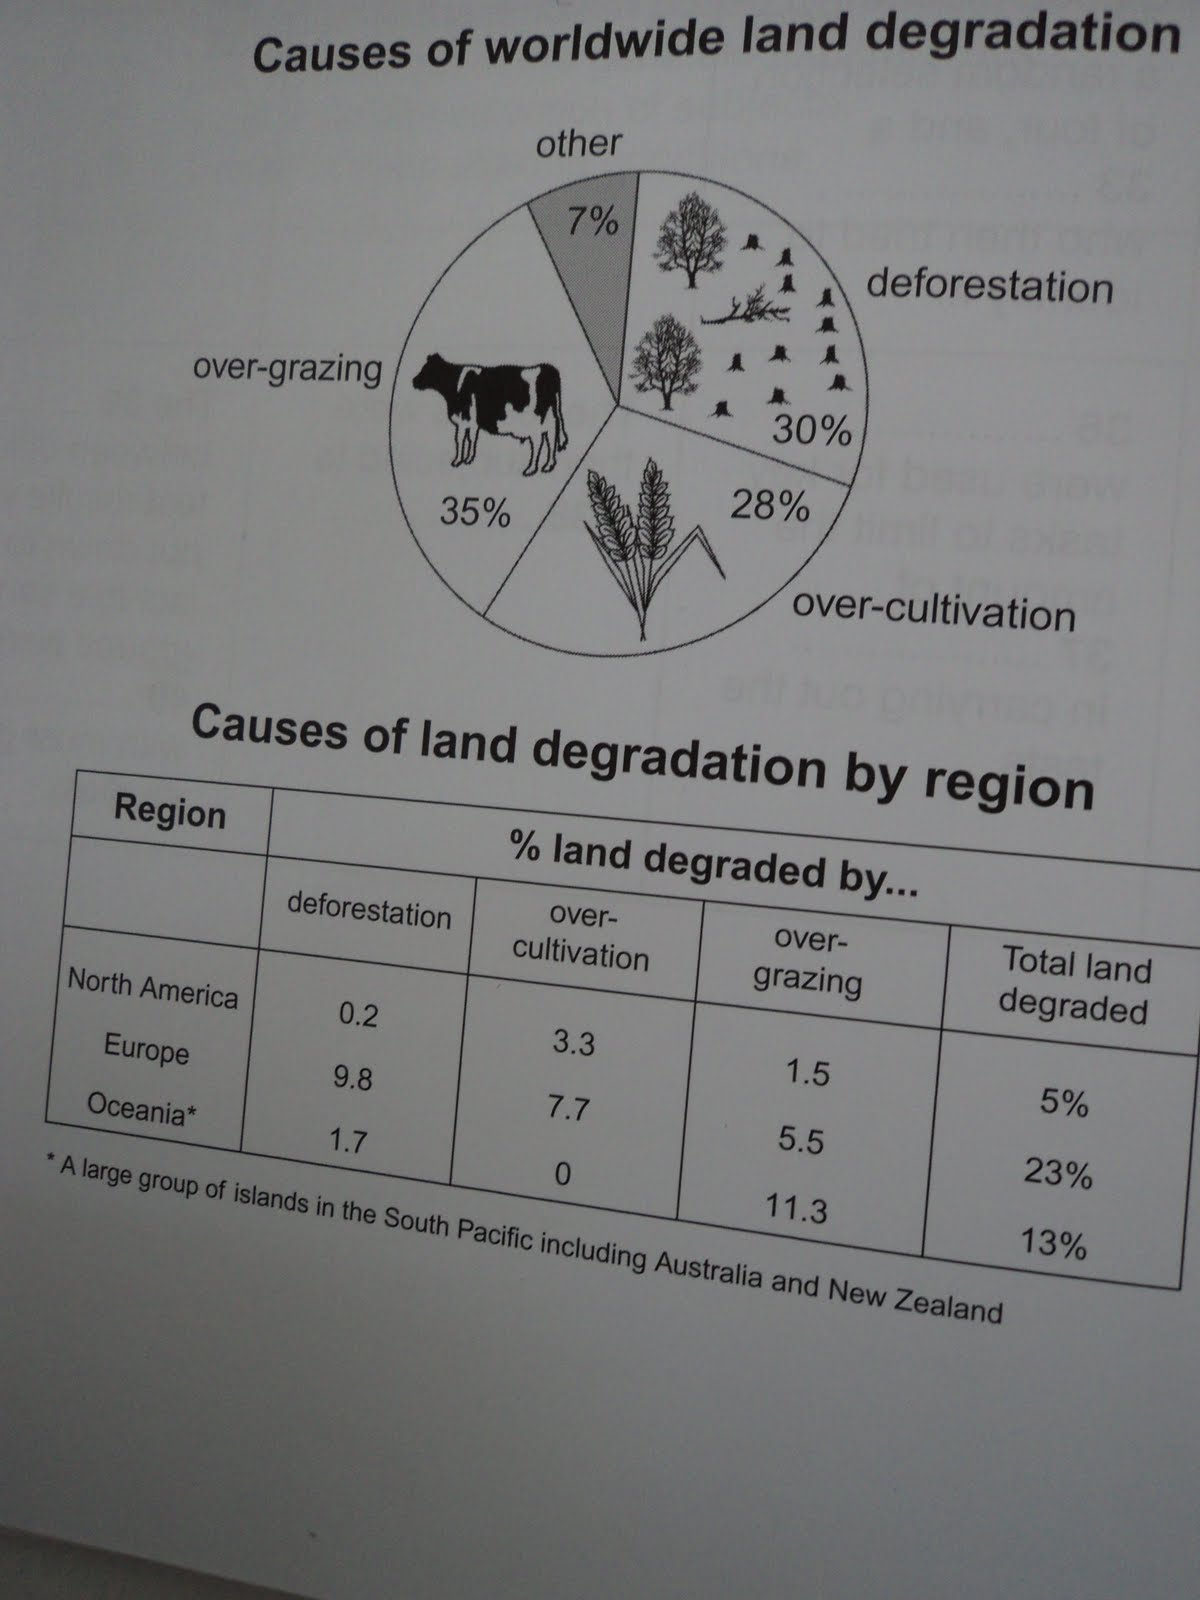
The pie chart below shows the main reasons why agricultural land becomes less productive. The table shows how these causes affected three regions of the world during the 1990s. Summarise the information by selecting and reporting the main features, and make comparisons where relevant
The given pie chart depicts the main cause of agricultural land becoming lesser productive.Also an evaluation is made on how these causes affected North America, Europe and Oceania during 1990s.
It was evaluated from the statistics that there were total four causes of land degradation.Almost 35% of land degradation occured due to overgrazing, followed by deforestation (30%). Further, over cultivation lead to 28% of world wide farmland degeberation. Other reasons altogher consituted 7%.
Out of thr three regions survyed in 1990s, Europe had most percentage of total degraded land,23%. Deforestation contiributed to 9.8% of this total, followed by over cultivation with 7.7% and over grazing with 5.5%. On the other hand Oceania have more effects by over grazing with 1.3% of land degraded due to it out of total 13%. By contrast , North America had only 5% of land degeneration and that to mainly caused by over cultivation and over-grazing with 3.3 and 1.5% respectively.
Thus it is evident that Europe suffered most in 1990s with farmland degradation of which deforestation and over-cultivation were main cause.

041.JPG
