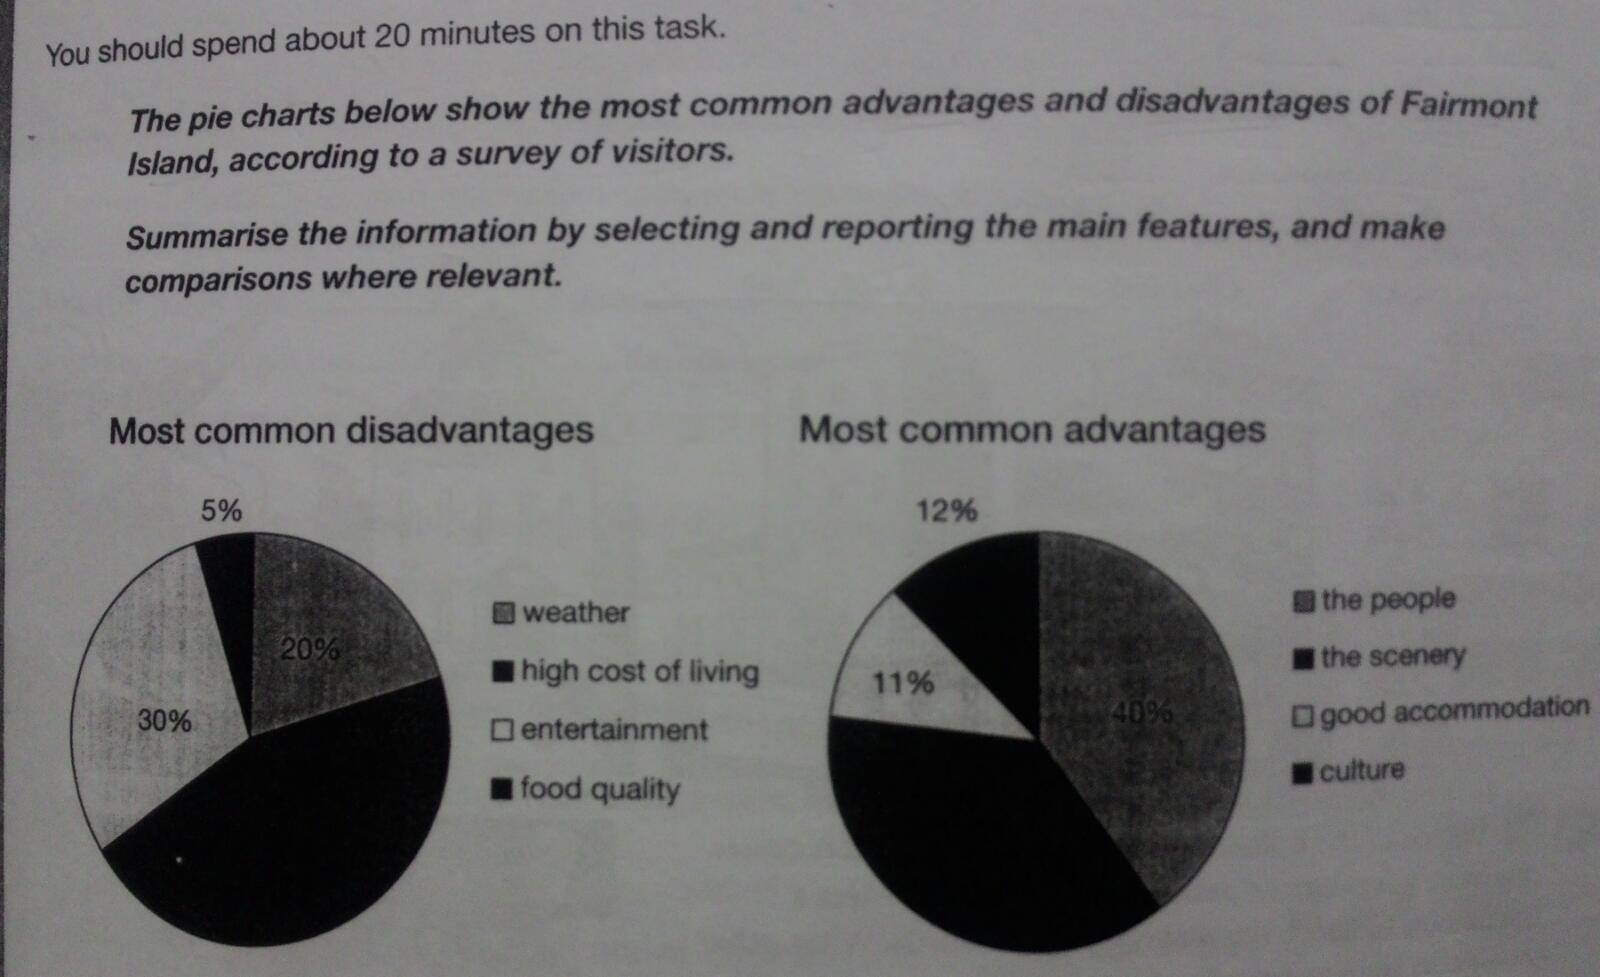
The pie charts below show the most common advantages and disadvatages of Fairmont Island, according to a survey of visitors. Summarise the information by selecting and reporting the main features, and make comparisons where relevant!
The two pie charts compared the visitors of most common advantages and disadvantagess of Fairmont Island measured in percentages. Overall, it experienced the significant fluctuation of both pie charts. While it ecountered a group which incresed drmatically in the number of visitor, other clusters witnessed a slight jump in the visitators quantity.
According to the data, it can be compared in two cluster of informations: an indicator indicated that high cost of living is the highest factor for visitor to unvisit the Fairmon Island at 45% respondents. The entertainment followed the position at 30%, then the wheater was at the third level in 20% as a factor causing the common disadvantages of Fairmont Island. The low factor was food quality in 5%. Constrast with that condition, the people of Fairmont Island was main factor of common advantages in 40%. In the second factor was the scenary around 37%. Then, it is followed by culture attraction in 12%. The last motivation was good accomodation in 11% of respondent aswers.

IMG20160202WA0009..jpg
