Unanswered [0]
  

Home / Writing Feedback   % width   Posts: 3


Popularity of the specialist, grammar and voluntary-controlled schools on three periods


ichaa 4 / 2  
Dec 1, 2016   #1
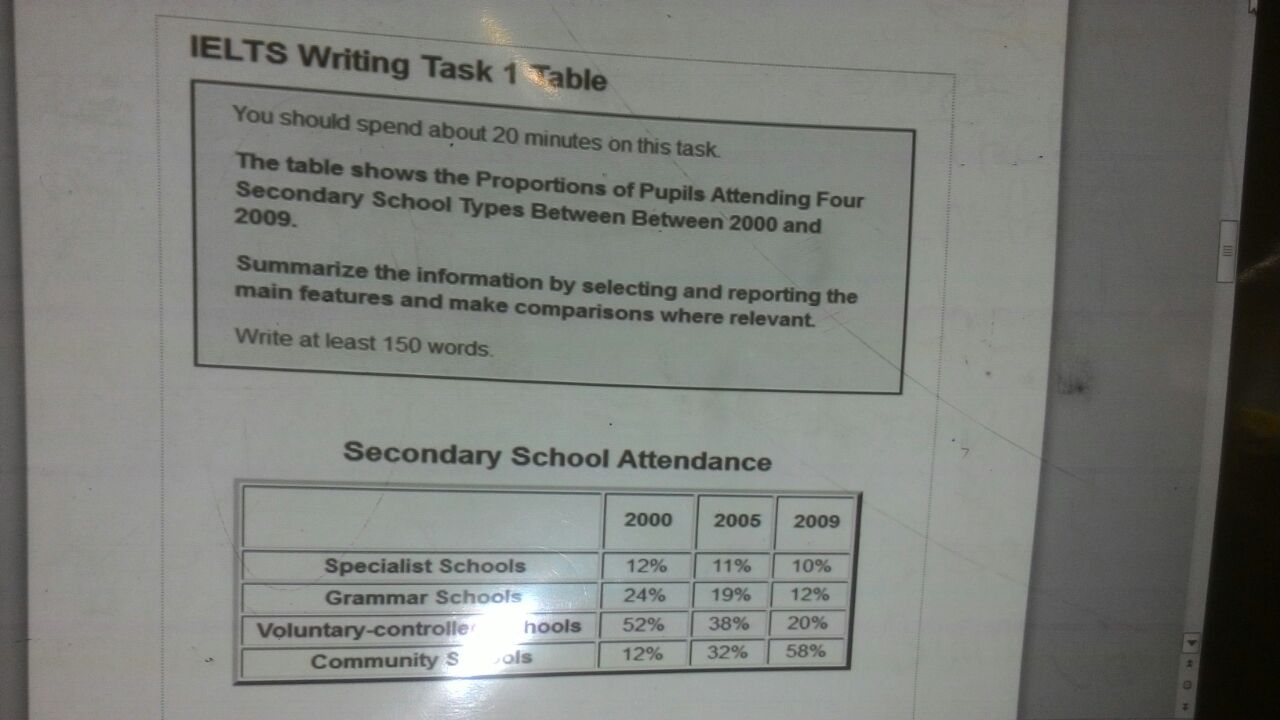
The table presents that the percentages of students attending secondary school types in three years of 2000, 2005 and 2009. Overall, the specialist schools, grammar schools and voluntary-controlled schools experienced decrease who students attended between 2000 and 2009. Meanwhile, the community schools climbed and became the highest percentage of students who attending secondary school in the same period.

Between 2000 and 2005, the percentage of specialist schools declined roughly 1% from 12% to 11% and it had the similar pattern by 2009. In the grammar schools percentage rapidly dropped in the every period (2000, 2005 and 2009) slightly under 25%, moved at 19% and then stood at 12%.

After 5 years the proportion showed several changes, While voluntary-controlled schools started getting fewer students (38%), community schools began getting far more students (32%) than this type of schools had 5 years earlier. At the last in 2009, the community schools had more than a half of result secondary rate and became the highest proportion among given pupils type.

  • secondary_school_att.jpg


Holt  Educational Consultant - / 15464  
Dec 5, 2016   #2
Ichaa, it is important for you to continuously represent the type of school in your summary. Specially in your last paragraph where you mention the digits for 2009. It seems that you decided to get sloppy and just gloss over the information by giving a worded overview instead of presenting the actual 2009 figures. For accuracy purposes, the essay must present all of the pertinent data until the very end of the summary. Otherwise, the summary becomes less informative and the process inaccurate.

Additionally, the last 2 paragraphs do not meet the minimum sentence requirement of 3 sentences per paragraph. You can easily resolve that issue by turning your commas into periods. Thus making a new sentence for each presentation rather than making it one continuously related sentence, which is what the comma creates in the sentences.
ichanpants89 16 / 742  
Dec 6, 2016   #3
icha, an exact data about the year or even percentage should not be appeared in the introduction paragraph of an IELTS task 1. An introduction paragraph is the place for explaining the question (paraphrase) and give an overview of the graph/chart/in this case, table. You have mistakenly put 2000 and 2009 a second time which indicates that those are the details. Your essay will only get 5 due to this issue. Please remember that "may have tendency to focus on details" is one of the criteria that is mentioned in the IELTS writing band descriptors in terms of Task Achievement.

Also, be more careful in writing the data. If you write three or more than three data / percentage more than three times in a single sentence, it can be considered as shop-listing and this will not bring any good towards your essay. The examiner will see you as a person who cannot briefly summarize the important information properly. My suggestion is that you can just mention maximum two clear data/percentage to avoid such repetition and shop-listing problem..


Home / Writing Feedback / Popularity of the specialist, grammar and voluntary-controlled schools on three periods
ⓘ Need Writing or Editing Help?
Fill out one of these forms for professional help:

Best Writing Service:
CustomPapers form ◳

Graduate Writing / Editing:
GraduateWriter form ◳

Excellence in Editing:
Rose Editing ◳

AI-Paper Rewriting:
Robot Rewrite ◳