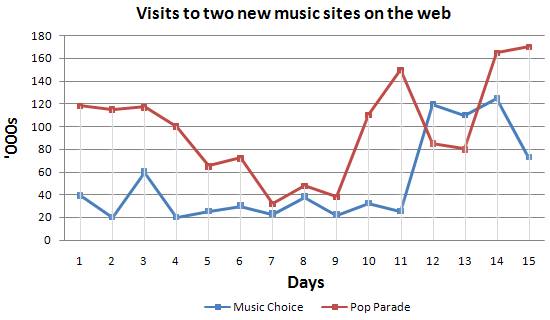
The line graph illustrates the comparison of the number of visitors of two new music websites, Music Choice and Pop Parade, over a fifteen-day period. Overall, it can be seen that there is a clear domination of Pop Parade within that half month period although it once has been surpassed by another site for 2 days (12th and 13th).
The Pop Parade site has been leading by 120.000 of visitors since the first day, and keeps continuing its superiority for 11 days consecutively. However, the trend actually starts decreasing gradually until reaches a trough of 30.000 visitors in day nine before it bounces back to reach its second peak by about 150.000 visitors in the 11th day. While it has dropped again for two days in day 12-13, it backs on top and even reaches its peak with 170.000 visitors in the last day (15th).
On the contrary, the Music Choice site is less favorable since it can surpass its competitor only for two days (12th and 13th) when it is hitting a high of 120.000 visitors in day 12. However, at the day 15, the number of visitors to this site fell to be around 70.000 visitors.
(198 Words)

13177905_10204576007.jpg
