a survey on happiness ratings for married and unmarried people in the US
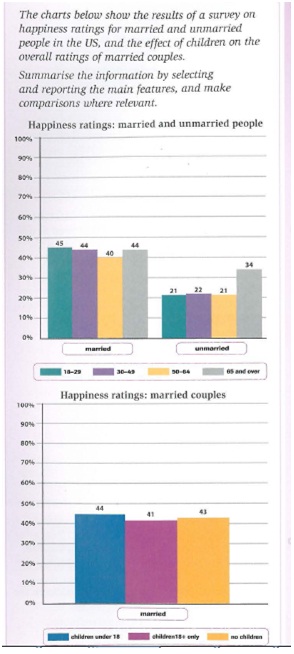
The bar chart illustrates the proportion of happiness of married and unmarried citizens living in the US according to different age brackets, and how children affect the total rate of married couples.
Overall, it can be seen from the first chart that the married couples feel more satisfied with their live than the population who does not marry. Noticeably, having chilren or not does not influence the happiness percentage of individuals who are in marital status.
With regard to the first chart, in terms of married people, the gap in the happiness portion of four age ranges do not change considerably, with 45% of the youngest age group, followed by 44% of the 30-49-years-old and 65 plus age bracket. The middle-aged group (30-64 years old) shows the trough of about 40%, which is slightly lower in comparison with the others. Respecting those who has not married, at the age of 18-29, 30-49 and 50-64, the percent of residents falling into these categories feeling great pleasant witness a downward trend compared to married couples, which peak at around 21-22%, whereas, the figure for the oldest age group is marginally higher, to 34% of the total rating.
Concerning the second chart, regardless of having children or in childless marriage, people still get a positive attitude to life, with a similar pattern of incrementing from 41% to 44% through all kinds of ages.

the charts
