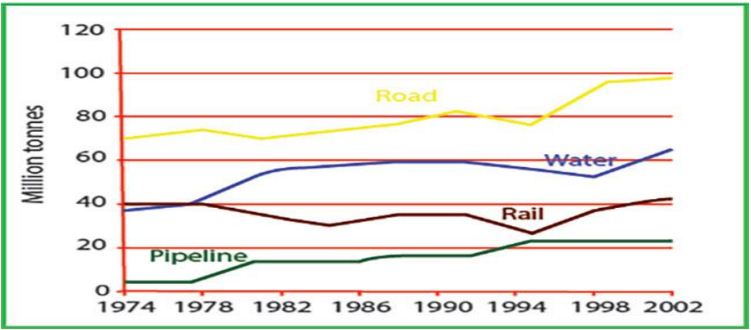
The graph shows the quantities of goods transported in the UK between 1974 and 2002 by four different modes of transport.
Writing Task 1
The line graph reveals the information regarding to the proportion of products transported in the United Kingdom by four different types of transport. It is measured by nmillion tones at four-year interval from 1974 to 2002. Overall, the most obvious fact is that the proportion of products that was carried by using road, was always the largest in each year over the time. Moreover, water was the second popular transportation in UK during the same period.
With regards to the two highest proportion in 1974, road quantity and rail quantity were stood at 70 and 40 successively. There was few decrease in the number of road over four-year period, while the figure of rail gradually by 10, from 40 in 1978 to 30 in the middle of 1986. However, concerning the remain yea, both of the changes had the same trend and increased marketly between 1994 and 2002. Road quantity and rail quantity reached 100 and above 400 respectively.
Concerning the rest point, the figure of water started at below 40 and the number for pipeline was 5 in 1974. These figure rose in 1978. Although the ration of water continued to remain steadly from 1982 to 1990, pipeline quantity growth gradually to above one-fifths in 1994 and remained over eight-year period. In contrast, the ratio of water inclined slightly at above three-fifths in 2002. (225 words)

Capture2.JPG
