Topic:
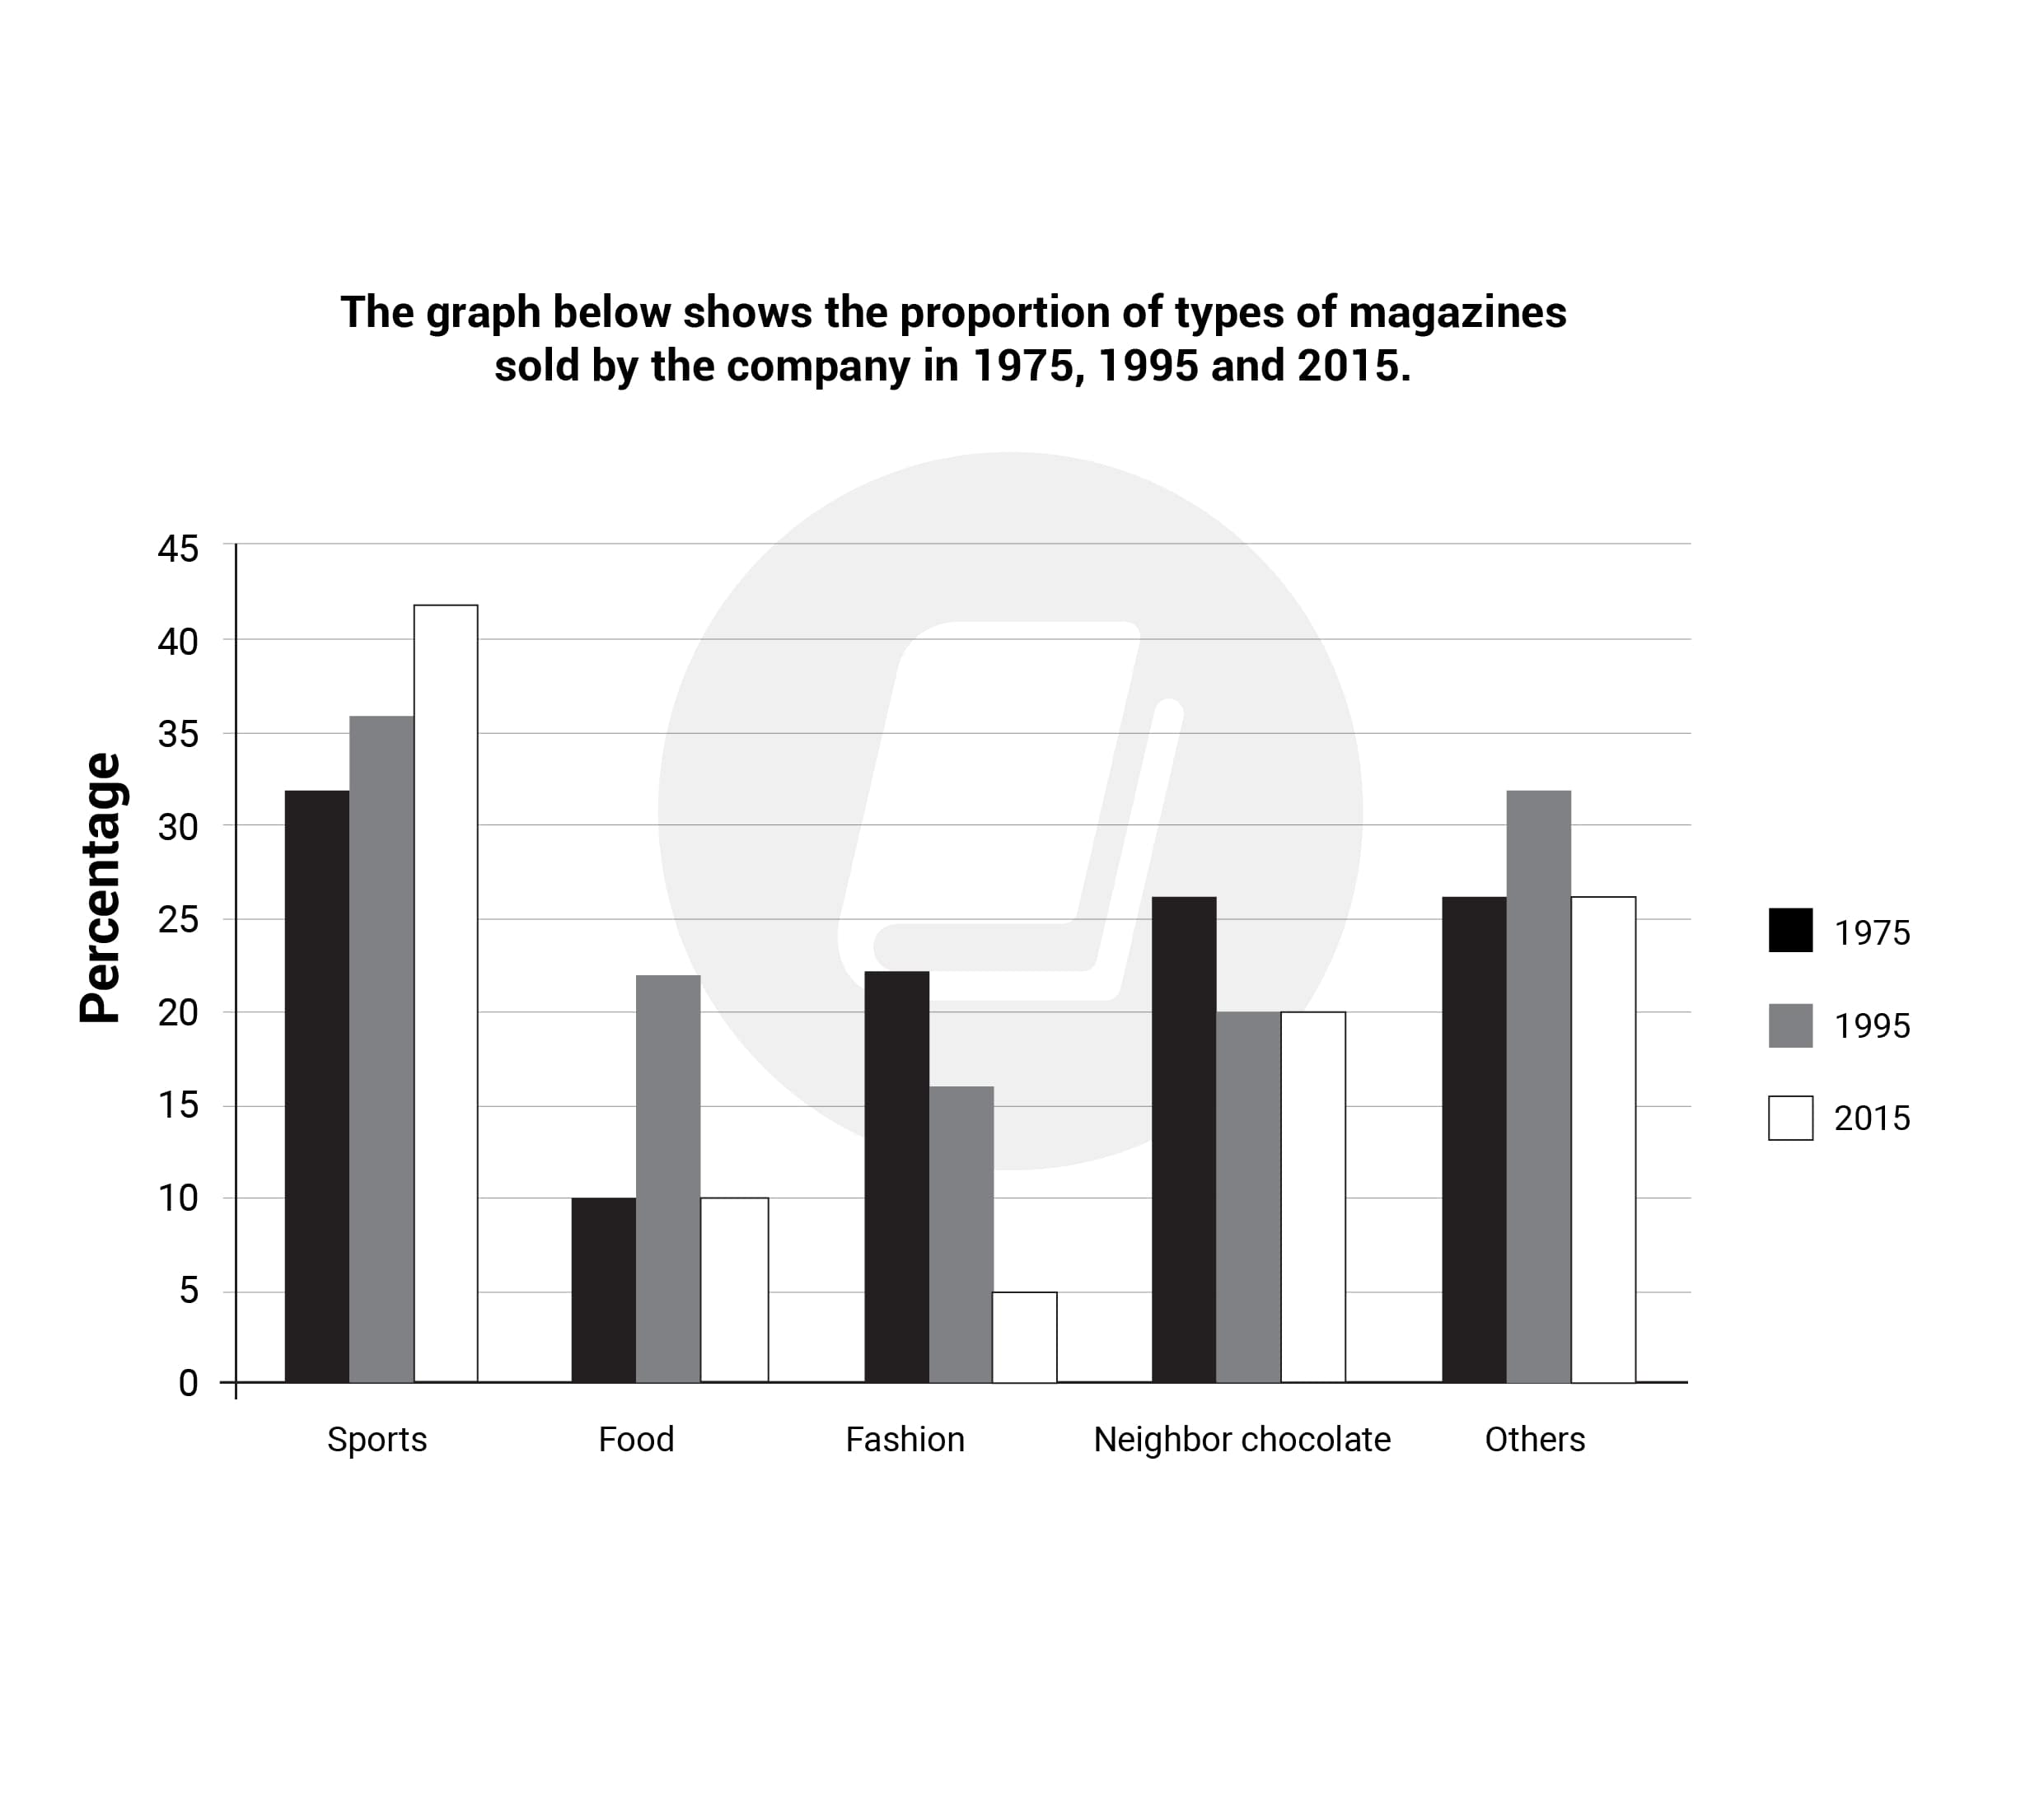
The graph below shows the proportion of types of magazines sold by the company in 1975, 1995 and 2015.
My answer:
The bar chart illustrates the percentage of kinds of magazines sold by the company between 1975 and 2015.
Overall, the sports magazine was the best-selling publication of the company as it was the only category portrayed a steady increase. However, fashion and neighbor chocolate magazines were in the opposite situation. Food and others type both showed a palpitation with their peaks recorded in 1995.
The preference for sports magazine saw a yearly growth evidenced by roughly 32% in 1975 to 42% in 2015. Interestingly, sports always triumphed over other types of magazines as shown on the chart, in which annual sale of this kind was approximately 2,5 times higher than the rest.
Regarding fashion genres with a downward trend, from 23% sales at the beginning, it dramatically sank to the lowest point of only 5% becoming the least favorite publication. At the same time, neighbor chocolate only moderately dropped from 26% in the first year to a plateau of 20% from 1995 to 2015.
Referring to rest, they fluctuated over the years with the same pattern. Food and unspecified genres both reached their selling peaks in 1995 with about 23% and 32% respectively. Furthermore, their sales in 1975 and 2015 in each category were equivalent followed by 10% for food and about 21% for other types.
If possible, can you give me an estimated band score for this piece of writing? Thank you so much!

giaideieltswritin.jpg
