TASK 1 ABOUT RADIO AND TV
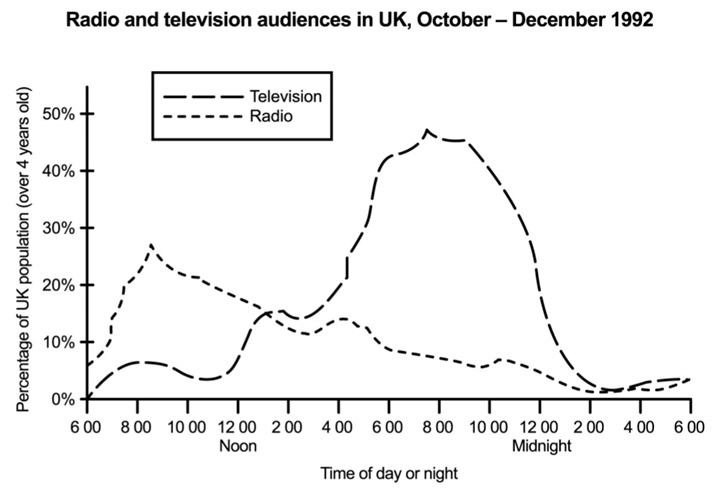
The line graph compares the proportion of the audiences in the UK of radio and television throughout the day from October to December in the year of 1992 .
It is clear that most people in the UK prefer to listen to the radio at morning and watch the television at dinner time, while the rates showed almost equal percent at the middle of the day and night.
In 1992, about 8% of residents in the UK turned up the radio to start the day, the rates saw a rapid rose to 28% arrived at the peak around 8.30 am, while some individuals chosen to open the television at approximately 7% when having the breakfast. At the moon, a general decline can be witnessed in the listeners of the radio until the midnight. By contrast, although the rates of television audiences experienced some fluctuations, a dramatic increase provided by the people opt for watching television.
Before the 2 p.m, the rates of the audiences overtook the listeners of the radio at 25% and saw a shape growth reaching the peak at 47% at 8 p.m. Compere to the stable decease of the radio listeners, the proportion of the television showed a surge decline from 43% to 3% stood at the similar amounts of the radio at the end of the period.

18f709a0d96811e9a.jpg
