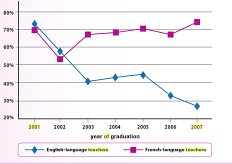
The graph below shows information about the recruitment of teachers in Ontario between 2001 and 2007.
summarize the information by selecting and reporting the main features, and make comparisons where relevant.
The line graph gives information regarding the first-year recruitment of teachers with regular teaching jobs according to year of graduation in Ontario from 2001 to 2007, a period of six years, and is measured in percentage. Overall, what stands out from the graph reveals that recruitment of English-language teacher fall significantly in the end of period. Note, although the number of French and English teachers saw the similar percentage at the beginning, the percentage of French teachers rose in the end of year.
at the first period, both English and French-language teachers had a similar recruitment at approximately 70 per cent and also both of them fell significantly to more than half (English) and 52% (French) in the next year. In 2003, while the recruitment of English teachers saw a sharp fall to two-fifths, French rose significantly in 68%.
According to the graph, since 2003 until 2005, English and French teachers recruited remained stable. On the other hand, the number of recruitment English teachers fell rapidly over next two years. In contrast with this, there was a dramatic increase in French which peaked at 75 percent at the end of period.

page_36.png
