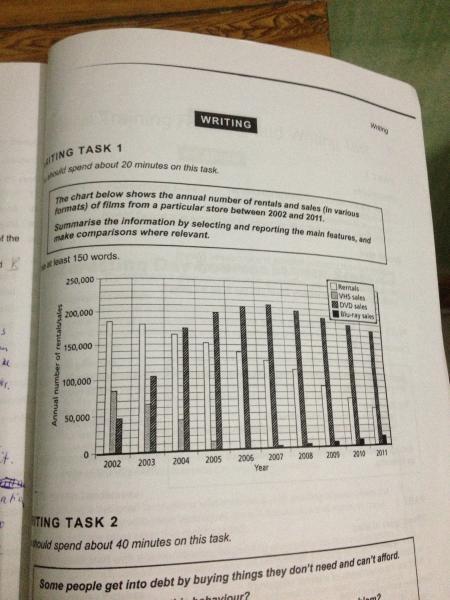
the annual number of rentals and sales
The given bar chart provides the sales and rentals volume of films in four different categories from 2002 and 2011.
The main point that can be observed here is that the figures for rentals and DVD sales experienced a downward trend in the number of rentals over a given period. By contrast, the number of Dvd sales increased impressively between 2002 and 2007. After that, the figure remained at the top of the chart.
Looking at the graph more closely, in 2002, the figure for rentals was the highest among the three categories at almost 180,000 followed by VHS sales, DVD sales at approximately 70,000, 40,000. There was a gradual fall of roughly 110,000 in 2011. It is worth pointing out that the sales volume of VHS went down steadily to 0.
In opposition to the two figures, the number of DVD sales stood at 48,000 in 2002. The figure saw a dramatic increase from 2002 to 2007, reaching a peak of almost 210,000. There was a slight drop to around 180,000 by 2011. When it comes to Blu-ray sales, in 2007, the sales volume of Blu-ray sales was the lowest figure. However, the figure increased slightly between 2007 and 2011.

big.jpg
