Writing IELTS TASK 1 the title of spending by local authorities in several lands
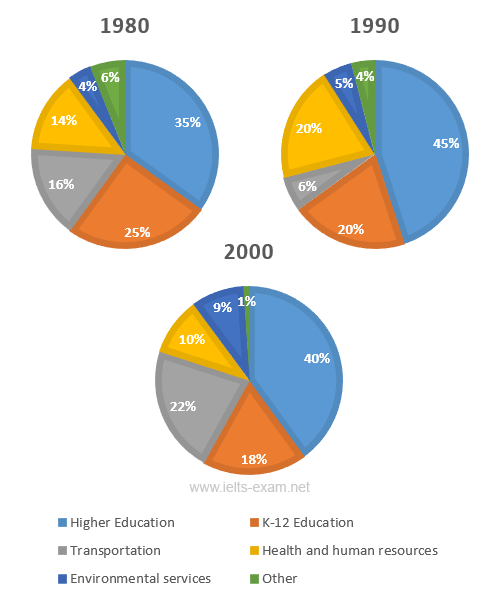
The pie charts display that the experts some of fields which changed per decade in 1980, 1990, and 2000. It is clear that the percentage of higher education, and health and human resources were the biggest proportion in every decade. While, the percentage of other fields were increasingly and decreasingly trend in every decade.
In 1980, the percentage of higher education was nearly a third and it was increasingly becoming 45% in 1990, then it was decreasingly trend 40% in 2000. The health and human resources were increasingly trend 14% in 1980 and it increased significantly 20% in 1990, then it decreased 10% in 2000. And, the percentage of transportation 16% in 1980 and it plunged slightly in 1990 then it was increasingly trend 22%.
On the other hand, the percentage of K-12 education was 25% in 1980 and it decreased 20% in 1990, then it was also decreasingly trend 18%. The percentage of other was 6% in 1980, then it was decreasingly trend 4% in 1990 and 1% in 2000. While, the environmental services were 4% in 1980 and it increased 5% in 1990, then it was decreasingly trend 1% in 2000.

