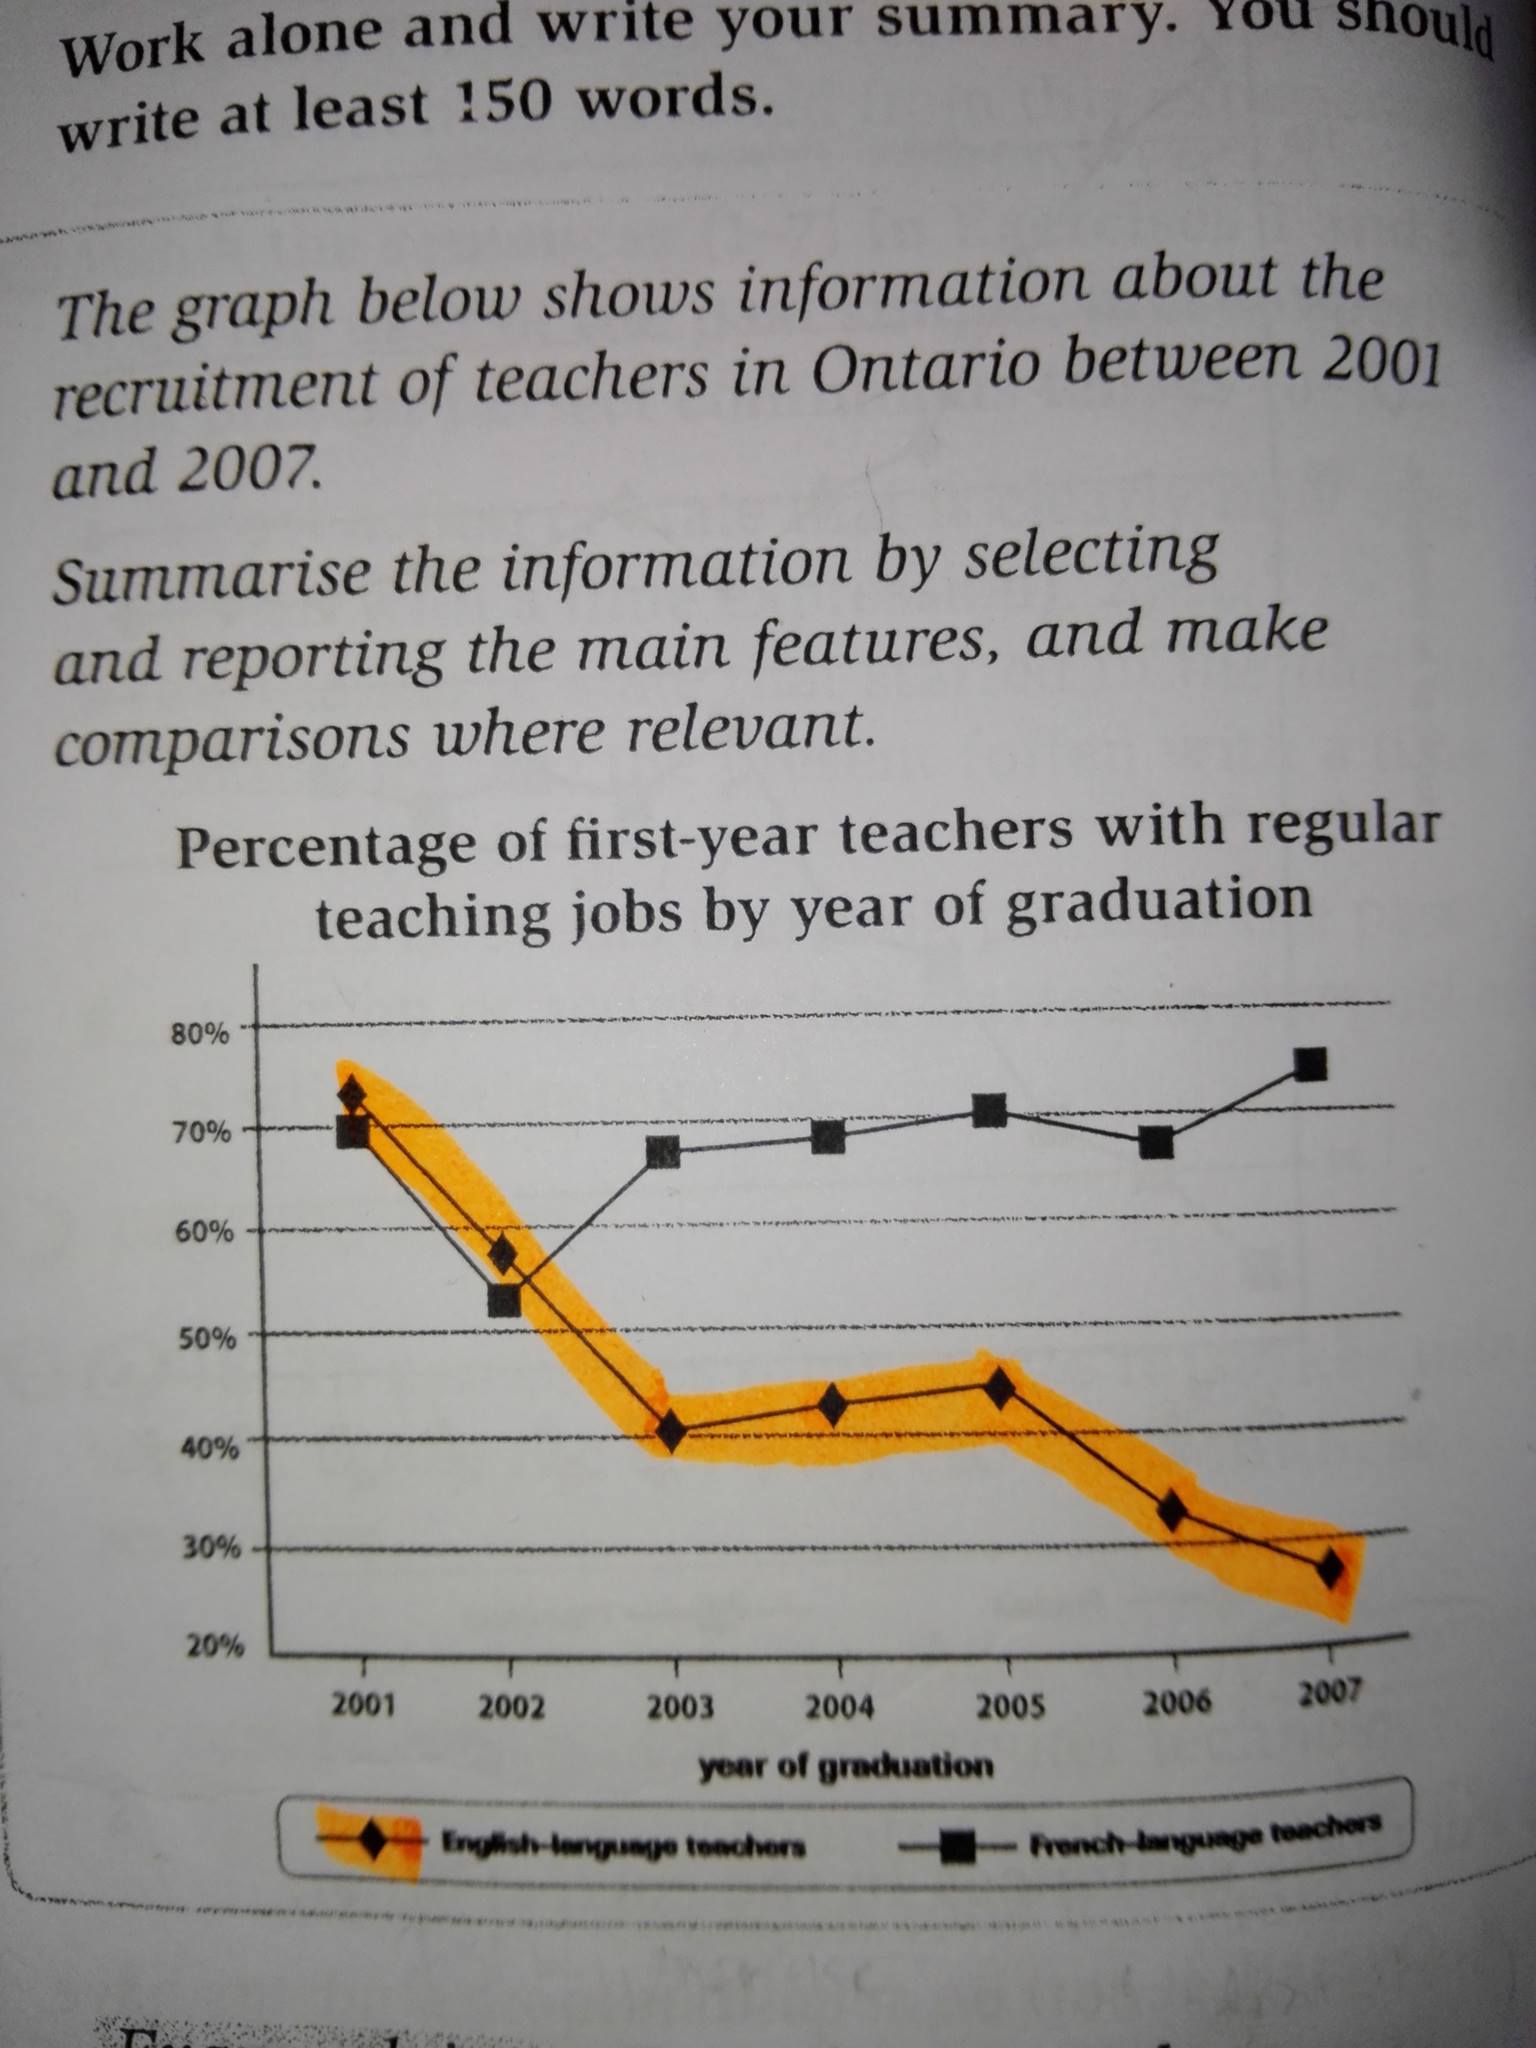
The line chart shows the information about the percentage of the number of teacher who have regular jobs according to year of graduation. The graph illustrates the fluctuation of the number of English and French teachers in Ontario between 2001 and 2007.
Overall, there was a downward trend of the number of French teachers. The highest number came from English teachers.
According to the graph, there was a dramatic decline of the number English teachers, from 75% to 40% in the three-first years. In the next year, rose slightly to 45% in 2005. And reached bottomed at 28 percent in 2007.
On the other hand, the number of French teachers fell by 17% in 2002. After that, there was a significant increase of 69%. In the four years later, there were a steady rise and fell again by 2 percent in 2006. After that reached a peak in the end year, at 73 percent.
In conclusion, the number of French teachers larger than English teachers. And in the end of the year French teachers peaked, but the French teachers were opposite which bottomed below 30%.

14853055_64322331254.jpg
