HELLO! I need helps with the following question:
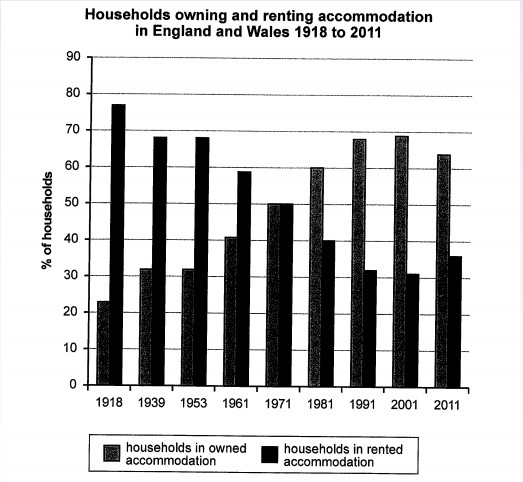
The chart below shows the percentage of households in owned and rented accommodation in England and Wales between 1918 and 2011.
Write at least 150 words.
The following blue print is my answer:
Crystalized in the column chart are the statistics in percentage of households regarding their forms of accommodation - both in ownership and in lease contract - in England and Wales between a spectrum of 94 years starting from 1918. Theses years witnessed a steady increase in owned accommodation for most the time and thus a corresponding stable decrease in that of rented forms.
According to the graph, approximately one fourth (23%) of the residents lived in their own accommodation in 1918, then the figure rose gradually to 50% in 1971 which was equivalent to that of those living in rented places, except a period of 15 years (from 1953 to 1961) that remained level at a little bit less than one third. There was a consistent growth until 2001, to nearly 70%, followed by a 5% dip in ratio in the next decade.
In stark contrast, however, the pattern for rented accommodation citizens in the period was totally in reverse. Beginning at a highest 77%, those who rented a place for living slowly fell to less than one third (31%), before a moderate climb of 5% to 36% in 2011. Again, in the middle of the time spectrum from 1918 to 2011, the two counterparts were equal in size.
Thank you very much!
The chart below shows the percentage of households in owned and rented accommodation in England and Wales between 1918 and 2011.
Summarise the information by selecting and reporting the main features, and make comparisons where relevant.
Write at least 150 words.
The following blue print is my answer:
Crystalized in the column chart are the statistics in percentage of households regarding their forms of accommodation - both in ownership and in lease contract - in England and Wales between a spectrum of 94 years starting from 1918. Theses years witnessed a steady increase in owned accommodation for most the time and thus a corresponding stable decrease in that of rented forms.
According to the graph, approximately one fourth (23%) of the residents lived in their own accommodation in 1918, then the figure rose gradually to 50% in 1971 which was equivalent to that of those living in rented places, except a period of 15 years (from 1953 to 1961) that remained level at a little bit less than one third. There was a consistent growth until 2001, to nearly 70%, followed by a 5% dip in ratio in the next decade.
In stark contrast, however, the pattern for rented accommodation citizens in the period was totally in reverse. Beginning at a highest 77%, those who rented a place for living slowly fell to less than one third (31%), before a moderate climb of 5% to 36% in 2011. Again, in the middle of the time spectrum from 1918 to 2011, the two counterparts were equal in size.
Thank you very much!

Snipaste_20220201_.jpg
