Hi everyone! Please give me some advice and feedback about this essay. I made this to practice for the IELTS exam. This is a sample of writing task 1.
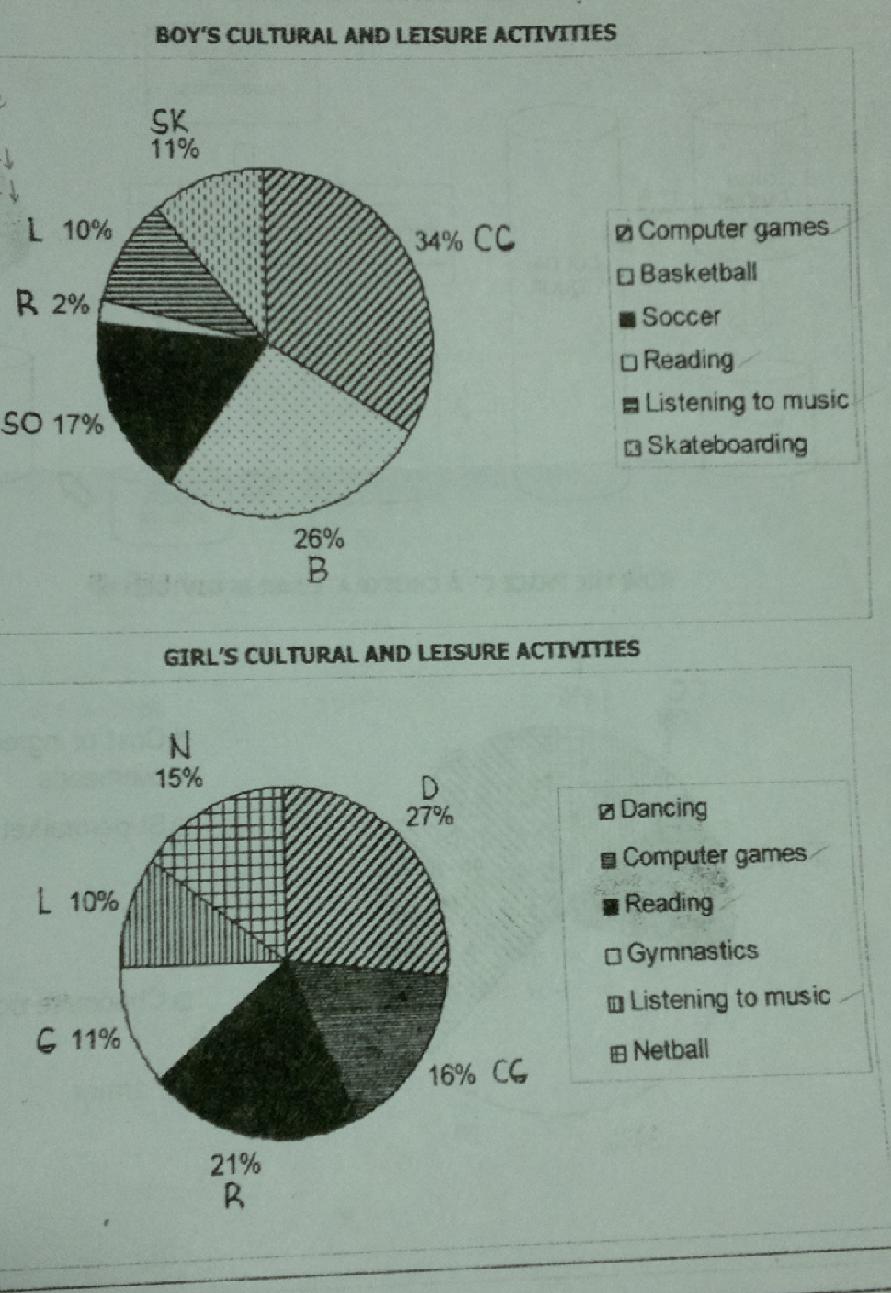
Task Description: The pie graphs below show the result of a survey of children's activities. The first graph shows the cultural and leisure activities that boys participate in, whereas the second graph shows the activities in which the girls participate.
Write a report describing the information shown in the two pie graphs. Write at least 150 words. (The graphs are found at the end of my essay)
Here's my answer:
The pie graph presents the outcome of a statistical survey about the cultural and leisure activities of boys and girls.
Most boys prefer playing computer games for their enjoyment. Following that is the more physical game of basketball and soccer. Skateboarding comes fourth followed by a more relaxing and laid-back activity which is listening to music; therefore, making reading as their last option.
On the other hand, girls choose dancing as their top activity, while reading, comes second. Computer games are also included in girl's preferences but it is only the third option. Netball, which requires good physical attributes is their fourth choice, while gymnastics, which requires flexibility is second to the last. Listening to music is least likely to be the girls past time.
Adding to that are some activities which are common to both sexes. First is the computer games which is the top preference of the boys, while, less that one fifth of the girls respondents are doing it. Second is reading which is the second to the top choice of girls and the last for the boys. Last is listening to music which comprises of the same number of the population of respondents of both boys and girls.

11.JPG
