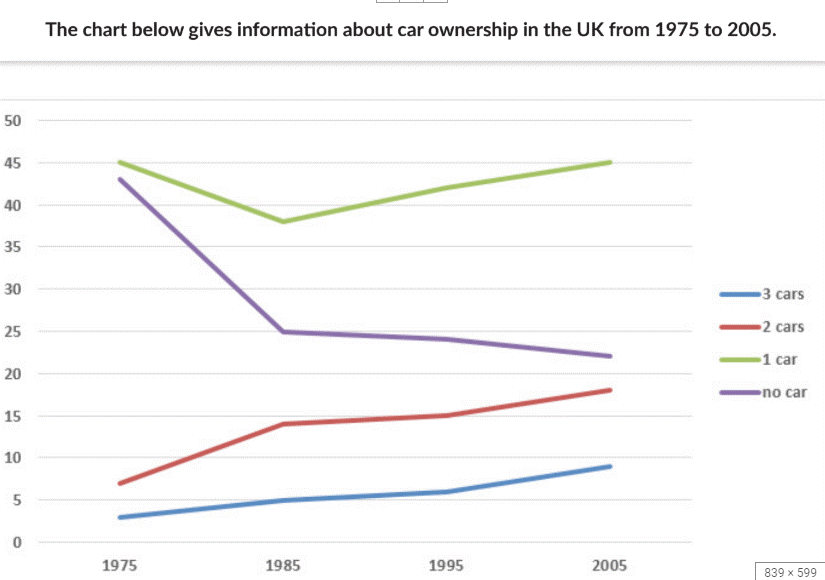
car ownership in the UK 1975-2005
line graph illustrates the proportion of car ownership in the UK over a period of 30 years from 1975 to 2005. Overall, the initial impression is that the percentage of people possessing 2 and 3 cars showed an upward trend. It can also be seen that having one car was the most common situation during the period given.
In 1975 people having one car accounted for 45% of the car ownership. This was followed by that of no-car owners at around 43%. In the next 10 years, both the categories witnessed a roughly similar trend. While the figure of 1 car experienced a substantial decline to its all-low time of 37%, there was fewer citizens without cars, with its figure dropping to 25%. Toward the end of the period, the proportion of 1-car owners experienced a considerable rebound to its same figure in 1975. Those not using a car, in a meantime, bucked the trend with 3% decrease.
Having 2 and 3 cars made up 7% and 3% respectively at the beginning of the period. Over the following 30 years, the same pattern was evident in those having 2 and 3 cars, with the latter hitting its peak of 17%, the latter peaking at roughly 9%.

1.png
