Unanswered [1] | Urgent [0]
  

Home / Writing Feedback   % width   Posts: 3


Turtles in India (four different species) - IELTS Writing Task 1, line graph


joseipg 1 / -  
Feb 17, 2020   #1

turtles population statistic


The line graph illustrates the number of turtles across four different species in India over a 32-year period from 1980 to 2012.

Overall, what stands out from the line graph is that while Olive Ridley Turtles experienced an increase, LeatherBack Turtles and Green Turtles witnessed a fall during the period. Moreover, All species remained almost constant throughout the period with some minor fluctuations. Additionally, all four species started with the same figure in 1980.

On the one hand, Olive Ridley Turtles' figures rose with small oscillations from 100 turtles in 1980 to approximately 130 turtles in 2012. This represent an increase of 30 turtles, which is the biggest increase in the four species. In contrast, LeatherBack Turtles' and Green Turtles' numbers experienced a steady decline from 100 turtles for both at the beginning to roughly 57 turtles and 90 turtles. The former stands with the biggest decrease in their numbers with 43 turtles.

On the other hand, All species stay approximately constant with some minor fluctuations between 110 turtles and 99 turtles.
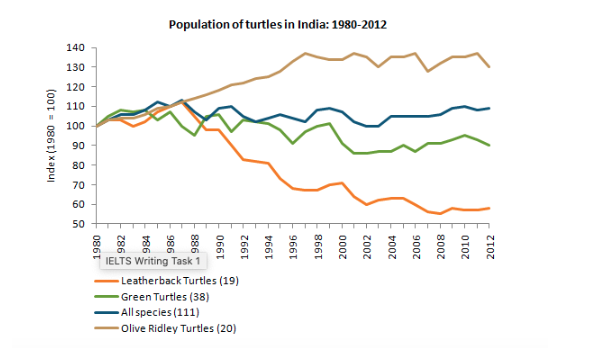

  • Population of turtles in India


Holt  Educational Consultant - / 15385  
Feb 18, 2020   #2
The summary overview could have been more completely represented in the paragraph by indicating several additional information. These information are:
- The types of turtles
- The index measurement
- The trending statement

While you did place the trending statement as a stand alone sentence at the end of the presentation. The task 1 essay is normally composed of only 3 paragraphs with the trending sentence placed somewhere in the summary overview. This creates a more informative summary and also, creates a more cohesive discussion presentation and outline for the discussion.

It seems that you failed to use the numbers indicated per turtle species in the chart. Why is that? The turtles starting population were signified by these numbers. You should have used it in the presentation prior to the comparative presentation.
Nguyet Tran 4 / 8  
Feb 23, 2020   #3
This represent (Noun - Verb agreement) an increase of 30 turtles

"In contrast, LeatherBack ... and 90 turtles." ...etc..

I'm confused which period that you mentioned in this sentence. I think it would be better if you can state the time frame.
Also, there was some outstanding data in this chart that you can indicate such as: the peak of number of Olive Ridley Turtles in 1997 and the fall of LeatherBack Turtles in 1987.


Home / Writing Feedback / Turtles in India (four different species) - IELTS Writing Task 1, line graph
Do You Need
Academic Writing
or Editing Help?
Fill out one of these forms:

Graduate Writing / Editing:
GraduateWriter form ◳

Best Essay Service:
CustomPapers form ◳

Excellence in Editing:
Rose Editing ◳

AI-Paper Rewriting:
Robot Rewrite ◳

Academic AI Writer:
Custom AI Writer ◳