Question: The graph below shows the unemployment rates in the US and Japan between March 1993 and March 1999. Write a short report for a university lecturer describing the information shown below.
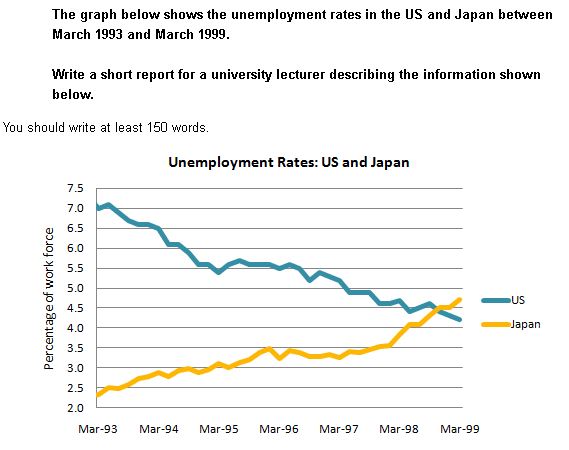
The line graph describes about the number of the unemployment in two advanced countries namely Japan and United States between March 1993 and March 1999 and is measured in percent. Overall, it is noticeable that both countries experienced a break of the equal level in the end of time frame.
In Japan, the percentage of the unemployment increased gradually from around 1.5% to about 3.5% by the end of March 1995. Afterwards, the trend experienced a drop approximately 0.5% in the beginning of March 1996 and stood at a fluctuation all the year round, but it grew up steadily by reaching about 4.75 % in the end of the period.
In contrary, in the mid-March 1993, the trend peaked at the highest level of the jobless rate around 7.0% in United States compared to Japan with only 2.5% jobless rate. However, in United States, there were continuous drop and fluctuation noted from the end of 1993 to the mid of 1996 and then sat at 5.0% in the beginning of March 1997, while Japan's jobless workforce rate kept growing upward steadily. Finally, the frequency of jobless workforce in United States was marked by 4.0% in March 1999 even minor falls and rises were found in the unemployment percentage all these years.

IELTS__Task_1_Line.jpg
