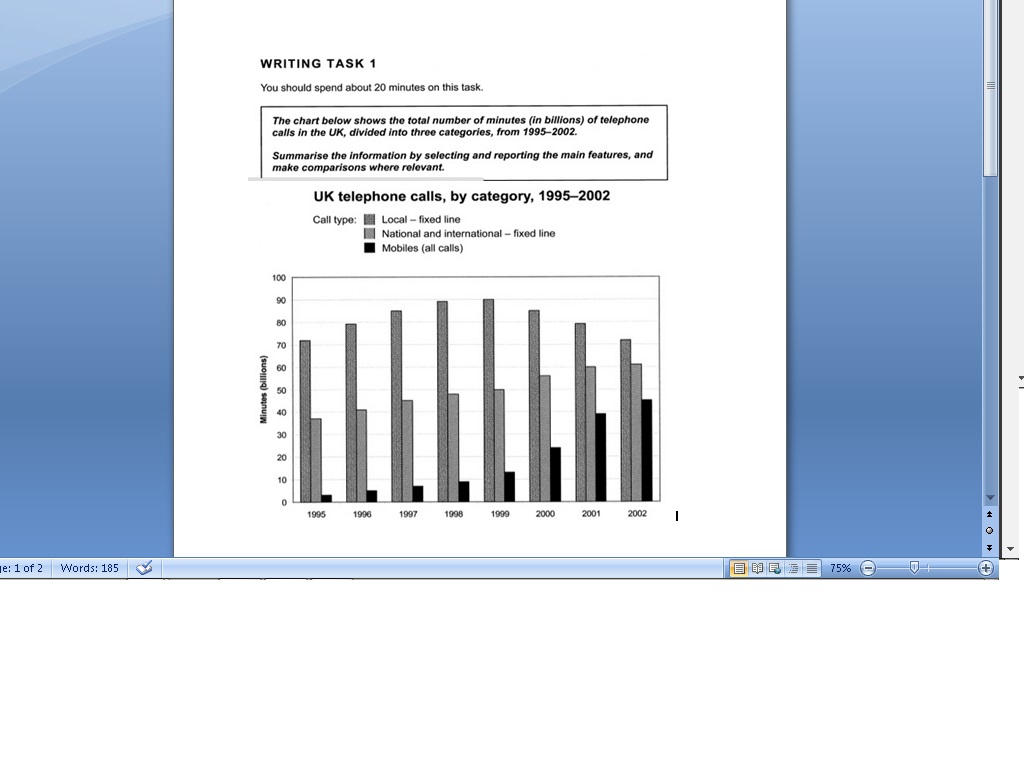
The bar graph elucidates information on the telephone minutes call (in millions) in the UK, which is divided into three categories-local, national and international fixed line and mobiles over the 7 year period between 1995 to 2002.
An overall impression reveals that there has been an upward trend in the national and international call lines and the number of minutes in the mobile calls, whereas the local call lines indicated a gradual decline throughout the time period.
Looking the graph in more details, the period between 1995 and 1998 saw a dramatic grown in the minutes of call in the UK. It reached a peak of 90 in 1999 but considerably fell to a low of 70. In contrast, national and international fixed line experienced a relatively slow increase from 1995 to 2002, while mobile phone calls rose significantly during the 7 year period. It peaked at close to 60 at the end of the year.
It is interesting to note that although local fixed line commence the highest figure that the two other classes, it adopted the same figure in 2002 approximately around 70-71.

table.jpg
