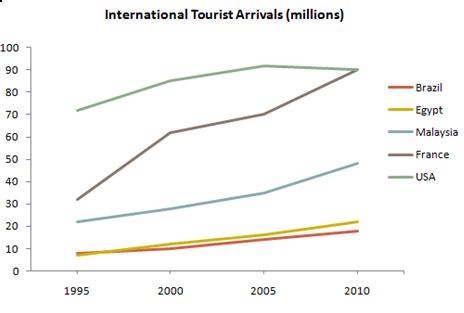
The graph below gives information about international tourist arrivals in five countries.
A breakdown of the information about international visitor arrivals in five different countries is depicted in the line graph. It is measured in millions at five-year interval from 1995 to 2010. Overall, it can be seen that USA was the most popular place to be visited over the time, and France appeared to gain the same number with USA in last year.
To begin with, only USA which had the largest starting point in the number of tourist arrivals. It stood at roughly 70, and stayed at 85 in 2010. On the contrary, France had a significant increase of 60 in the figure for tourist, and it projected to peak at 70 in 2010.
Concerning to the rest parts, the quantity of Malaysian visitors increased markedly by 20 from 30 in 2005 to 50 in 2010. Meanwhile, the figure for Brazil; and Egypt had a similar pattern which started at approximately just under one ten. Egypt appeared to lead slightly from Brazil in visitor number at just over a fifth and rougly 18 in a row. (176)

Inter2.JPG
