Please help me to rate this essay base on ielts writing task 1 target.
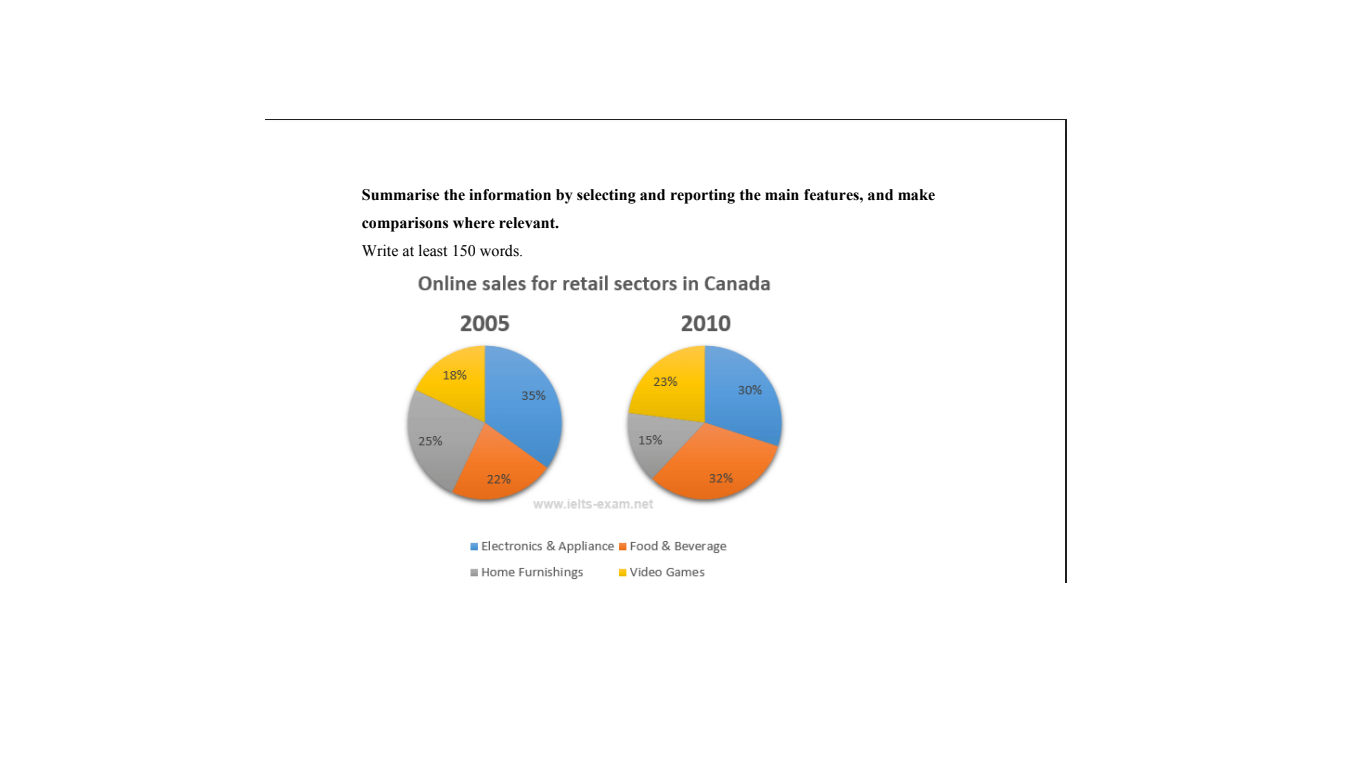
The given charts compare the variance in terms of four online sales sectors in Canada in two years 2005 and 2010.
Overall, the proceeds percentage of Video Games, Food and Beverage increased sharply; while that of Electronics and Appliance, House Furnishings decreased.
In 2005, the sales for Electronic and Appliance hold a remarkable proportion with 35%, however this declined to 30% in the year 2010. Similarly, the percentage of Housing Furnishings witnessed the same trend. In the first year, the number was accounted for one - fourth of the total online sale of these four sectors, but this fell to just 15% in 2010.
In contrast, the percentage of Video Games and Food and Beverage both experienced an upward trend. In 2005, the figure of Food and Beverage was 22%, then went up sharply to 32% in 2010. Moreover, the proportion of Video Games was 23% in the year 2010, which is 4% higher than that in 2005.
the online shopping sales for retail sectors in Canada
The given charts compare the variance in terms of four online sales sectors in Canada in two years 2005 and 2010.
Overall, the proceeds percentage of Video Games, Food and Beverage increased sharply; while that of Electronics and Appliance, House Furnishings decreased.
In 2005, the sales for Electronic and Appliance hold a remarkable proportion with 35%, however this declined to 30% in the year 2010. Similarly, the percentage of Housing Furnishings witnessed the same trend. In the first year, the number was accounted for one - fourth of the total online sale of these four sectors, but this fell to just 15% in 2010.
In contrast, the percentage of Video Games and Food and Beverage both experienced an upward trend. In 2005, the figure of Food and Beverage was 22%, then went up sharply to 32% in 2010. Moreover, the proportion of Video Games was 23% in the year 2010, which is 4% higher than that in 2005.

Untitled.png
