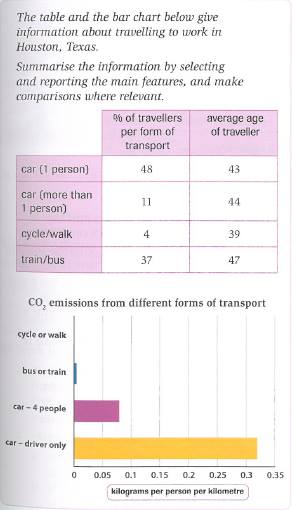
The table and the bar chart below give information about travelling to work in Houston, Texas.
Summarise the information by selecting and reporting the main features, and make comparisons where relevant.
The table and chart show the proportion of employees in Houston, Texas to work using four different transports. Also, these show the average age of travelers and how much carbon dioxide produced by each vehicles. Overall, it can be seen that workers tend to use private car, it causes the amount of carbon dioxide resulted is extremely high.
With regards to the transportation use, private car is the most favored vehicle to go to office with the number of commuters just under a half percent. There is train or bus in the second rank with 37% laborers totally. Further, the least percentage showed by car driven many workers and cycle or walk, only 11% and 4% each.
People aged between 43 and 44 more likely use cars. In addition, humans aged almost a half century tend to take a public transport such as train or bus, while those aged almost 40 prefer to take bicycle or on foot.
Private car produces the highest amount of carbon dioxide, roughly 0.32 kilograms per person while another car results approximately 0.08 kilograms. The least percentage indicated by bus or train and cycle or walk which generate 0.1 kilograms and none emissions respectively.

Second_pict.jpg
