Unanswered [2] | Urgent [0]
  

Home / Writing Feedback   % width   Posts: 2


IELTS Writing Task 1: 'waste table' essay - The table below shows the amount of waste production


Rogerscup 5 / 8  
Aug 16, 2018   #1

the amount of waste produced in six different countries


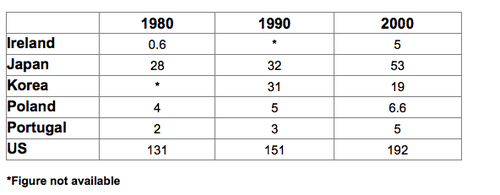
The table below shows the amount of waste production (in millions of tonnes) in six different countries over a twenty-year period.

The graph compares the amount of waste that were produced in six different countries in the year 1980, 1990, 2000.

It is clear that US produced the more waste than any other countries in each of the years. Furthermore, Korea was the only country showing a decrease of waste production between 1980 and 2000 while other nations rose the waste production during the period.

Between 1980 and 2000, waste production waxed from 131 to 192 million tonnes in US, and there was also a trend of rise in Japan, Poland, Portugal. Japan was a second high waste producer having 28 million tonnes waste production and rose to 53 million tonnes in two decades, whereas Poland and Portugal saw a total increase from 4 to 6.6 and from 2 to 5 million tonnes respectively.

However, the table showed a great difference in Ireland and Korea. In Ireland, the waste production was made more than eightfold showing a large increase from solely 0.6 million tonnes in 1980 to 5 million tonnes in 2000. Korea, by contrast, reduced its waste production roughly 12 million tonnes from year 1990 to 2000.

  • 6a0120a5bb05d8970c01.png


TJLuschen - / 236  
Aug 31, 2018   #2
Hi, here are some suggestions:

The graph {this is not a graph, it is a chart or table} compares

amount of waste that was produced ... in the years 1980...

It is clear that the US produced the more waste than any of the other countries

... of waste produced between 1980 ... nations increased their waste production

... waste production waxed {this sounds pretty odd - waxed is really only used for the moon phases} from ...

there was also a rising trend in Japan, Poland, and Portugal. Japan was the second highest waste ... tonnes of waste production , which rose to 53 million tonnes over the following two decades

... difference between Ireland ... production expanded more than ... from only 0.6 ...

... from the year ...


Home / Writing Feedback / IELTS Writing Task 1: 'waste table' essay - The table below shows the amount of waste production
Do You Need
Academic Writing
or Editing Help?
Fill out one of these forms:

Graduate Writing / Editing:
GraduateWriter form ◳

Best Essay Service:
CustomPapers form ◳

Excellence in Editing:
Rose Editing ◳

AI-Paper Rewriting:
Robot Rewrite ◳

Academic AI Writer:
Custom AI Writer ◳