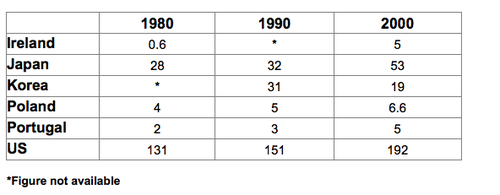
A breakdown of the number of wasting output in several countries from 1980 to 2000, a 20-year periods presented in table. Overall, the amount of waste producing increased gradually. In any case, America saw the highest waste production, while the figure for Portugal and Ireland showed reverse.
It is noticeable that US was by far the most popular of waste output for the majority of twenty years period. However, there was a dramatic rose from 1980 to 2000 by 61 over the year. Compared to Portugal and Ireland stood at under 2, by 2000, the number of waste producing in both countries grew minimally to 5, which was the low level of waste production.
By contrast, in 1980 waste production in Japan was representing at 28, while in Poland just at 4. Interestingly though, Korea produced none waste in the beginning of period, but it had upwards trend over following 20 years at 19. As the same way, the waste output in Japan and Poland rose gradually to 53 (Japan) and 6.6 (Poland).

The_table_below_show.png
